Every other order flow signal is about what the aggressors are doing. Absorption is the one that is about who is beating them. Somewhere on your chart, a passive player is standing at one price, taking every contract thrown at them, and refusing to let the market through. On a candlestick chart this looks like nothing: a flat, boring bar. On a footprint it is the loudest event of the session.
Absorption trading is the skill this entire cluster has been building toward: the order flow pillar called absorption the most valuable of the three core reads, and the delta divergence guide showed how mistaking it for weakness costs traders money. This guide covers the mechanics, the footprint tells, the exhaustion distinction, and the honest failure cases.
What is absorption in trading?
Absorption in trading is what happens when aggressive market orders pour into a price level and fail to move it, because passive limit orders on the other side keep refilling and taking every contract. Heavy volume with no price progress: the aggressors are being absorbed, and they are losing the fight.
The logic sits on the mechanics from the order flow trading guide: price moves when aggression consumes the resting liquidity at a price, or when that liquidity is pulled. Absorption is the case where consumption keeps failing. Sellers hit the bid at 5,280.00 again and again, and the bid is still there, because someone keeps reloading it. Often the size never even shows: iceberg orders display a slice of themselves and refill silently, which is why the wall you can measure is the volume that traded, not the size on the ladder.
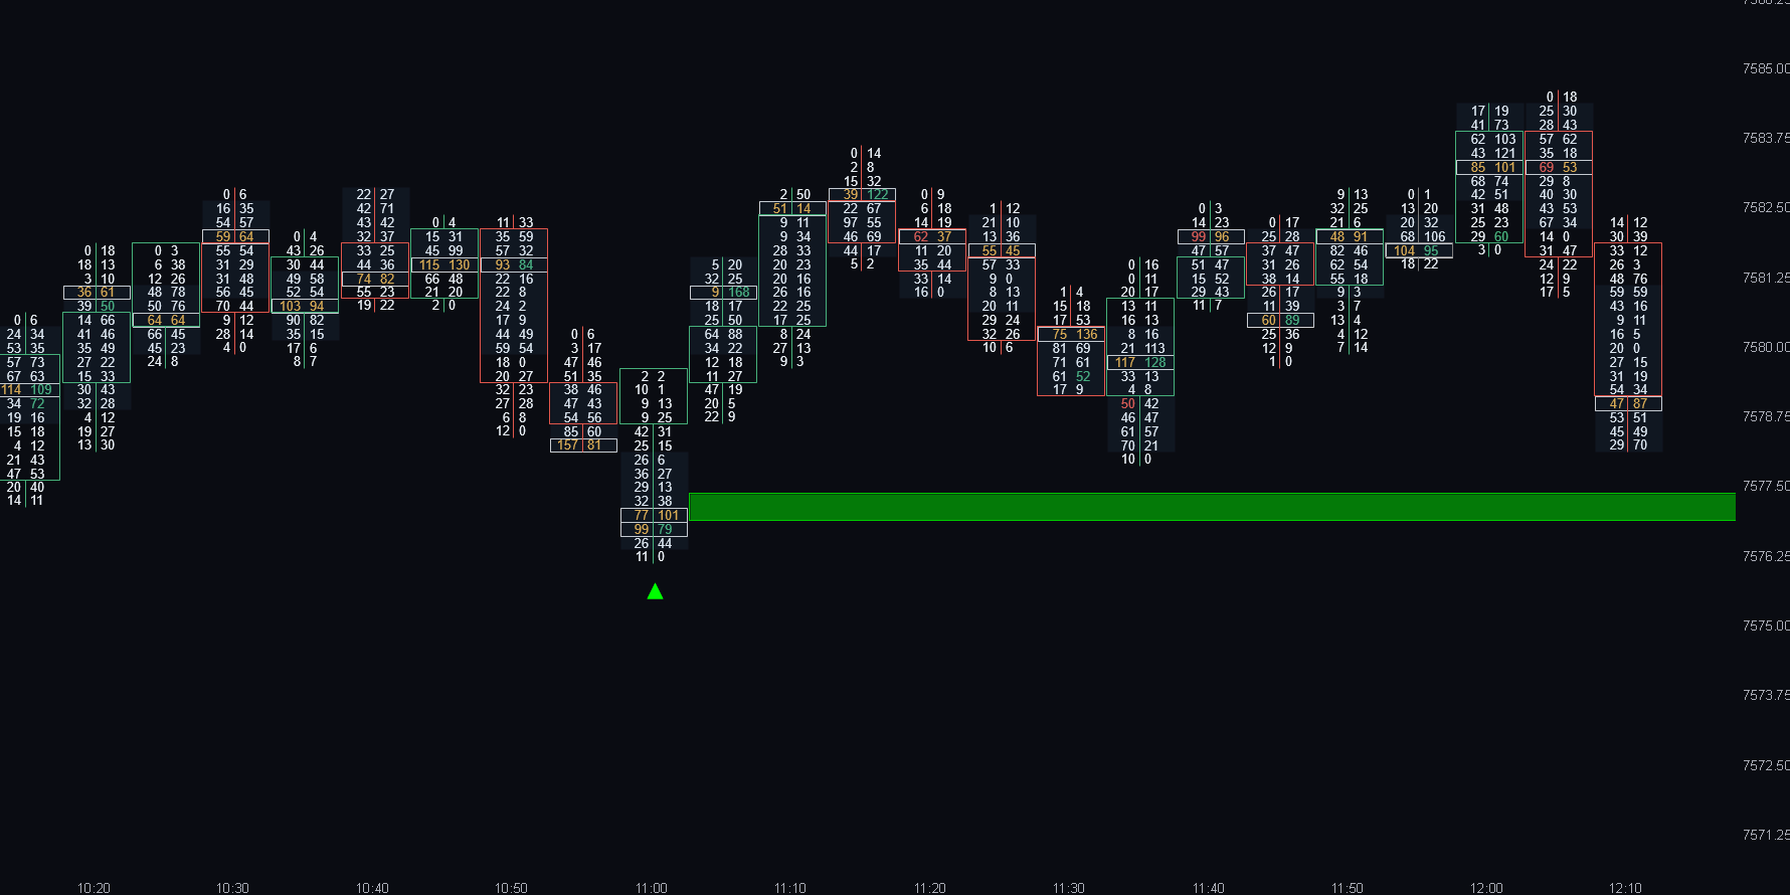
How to spot absorption on a footprint chart
Order flow absorption has a specific fingerprint on the footprint, and it is a cluster of tells rather than one number:
- Heavy volume at the extreme, flat lows. The bottom cells of consecutive bars print large bid-side volume while the lows stay within a tick or two of the same price.
- Deeply one-sided delta with no follow-through. Bars print strongly negative delta, yet close off their lows. Effort without result, bar after bar.
- The POC pins to the level. The highest-volume price of each bar sits at or next to the defended price, because that is where the fight is happening.
- The ladder understates it. The visible bid may look ordinary; icebergs refill quietly. Trust the traded volume in the cells, not the displayed size in the book.
- The flip completes the picture. Real absorption resolves with aggression changing sides: buy imbalances printing at the lows while the level still holds. Until then you have a suspect, not a verdict.
An absorption indicator can flag this fingerprint automatically as bars close, which helps while your eye is still training. Every tell on the list stays readable by hand in the cells; the automation is a convenience, not a requirement.
Bullish and bearish absorption
The pattern is symmetric; only the absorbing side changes:
- Bullish absorption: aggressive sellers pour into a low, passive buyers take everything, the level holds. The trapped shorts above become the fuel for the move up.
- Bearish absorption: aggressive buyers lift into a high, passive sellers refill the offer, the level holds. The trapped longs below become the fuel for the move down.
In both cases the absorbed side is the loser. If the phrase “buying pressure” still makes absorption feel bullish for the buyers, remember: in this pattern the aggressive buyers are the ones being stopped.
Absorption vs exhaustion
These two get confused constantly, because both mark the end of a move at an extreme. They are opposite fingerprints:
| Absorption | Exhaustion | |
|---|---|---|
| Volume at the extreme | Heavy, often the heaviest of the session | Fading to near nothing |
| What ends the move | A passive player defeats the aggressors | The aggressors simply run out |
| The fight | Intense and lost | Never happens; nobody is left |
| Footprint tell | Big one-sided cells, flat extreme, pinned POC | Tiny cells at the tip, a clean finish |
| Aftermath | Trapped traders fuel a sharper rotation | Drift or rotation on low energy |
The distinction matters for expectations. Absorption reversals tend to be violent, because a crowd of trapped aggressors has to exit through a door that just closed. Exhaustion reversals are often lazy, because nobody is trapped; the market just stopped. Both are covered as reads in the order flow pillar guide; this table is the side-by-side.
Is absorption a reversal or continuation signal?
Neither, precisely: absorption is a stopping signal. It tells you the current push is being defeated at this price. What happens next belongs to the absorbing side, and the practical readings follow from where it prints:
- At a defended level against the move, prior day low, range edge, value area boundary, absorption is the classic reversal context: the push is stopped, the pushers are trapped, and the rotation back is the trade.
- Within a trend, against the pullback, absorption works as continuation: the passive player is defending the trend’s direction, eating the countertrend flow before the next leg.
Same fingerprint, same logic, different geometry. What absorption never is: an entry by itself. The entry is the flip.
Where absorption is most reliable
Absorption is only meaningful where a passive player has a reason to stand and fight. The levels that qualify are the ones where resting orders cluster, which is the subject of the liquidity guide:
- Prior day high and low, the most-watched levels on any futures chart.
- Range edges and value area boundaries, where responsive traders habitually do business.
- High-volume nodes and session POC, prices the market has already agreed are fair.
- VWAP, the institutional benchmark, especially on first touches.
Absorption in the middle of nowhere is somebody’s exit, not somebody’s stand. And if the idea of a large player quietly buying everything the crowd sells feels familiar, it should: it is the footprint-level view of accumulation, the behavior the Wyckoff method described a century before footprint charts existed.
Trading absorption: the sequence
- Start at a level that matters, from the list above. No level, no trade.
- Watch for the fingerprint: heavy one-sided volume, flat extreme, pinned POC, deeply skewed delta with no progress.
- Wait for the flip. Aggression must change sides at the level: opposite imbalances at the extreme, delta turning. The wall alone is not the trigger; walls pull.
- Stop goes beyond the absorbed extreme. If price trades cleanly through the level that was being defended, the defense failed and the trade is wrong by definition. That invalidation is what makes absorption trades unusually honest: the line is drawn for you.
When absorption fails
The failure cases are as instructive as the pattern:
- The wall pulls. Passive orders are commitments only until cancelled. A player who absorbed two thousand contracts can vanish before the third thousand, which is exactly why the flip, not the wall, is the trigger.
- The absorber gets overrun. Even genuine defense loses to enough initiative. When the level breaks, the absorbed side’s stops make the breakout violent; do not stand in front of it because the absorption “looked strong.”
- News resets everything. Into CPI or FOMC, resting liquidity evaporates and defended levels stop meaning anything. Absorption reads pause when the calendar takes over.
- One player’s exit imitates it. A fund unloading a position passively can print absorption-like volume with no intention of defending anything afterward. Location and the flip filter most of these; nothing filters all of them.
Absorption is proven by traded volume, confirmed by the flip, and invalidated by the level breaking. All three parts are visible on the footprint, which is why this is a read, not a prediction.
Frequently asked questions
What is absorption in order flow trading?+
Absorption is when aggressive market orders pour into a price and fail to move it, because passive limit orders keep refilling and take every contract. Heavy volume with no price progress means the aggressors are losing; the passive side is stopping the move and trapping the attackers.
How do you spot absorption on a footprint chart?+
Look for the cluster of tells at an extreme: unusually heavy volume in the bottom or top cells while the extreme stays flat, deeply one-sided delta with bars closing off their extremes, and the POC pinned to the defended price. Confirmation is the flip: opposite-side imbalances printing while the level still holds.
What is the difference between absorption and exhaustion?+
Absorption is a fight that the aggressors lose: heavy volume into a level that refuses to move. Exhaustion is a fight that never happens: volume fades to nothing at the extreme because the aggressors ran out. Absorption traps traders and tends to reverse violently; exhaustion reversals are usually lazier.
Is absorption a reversal or a continuation signal?+
It is a stopping signal that favors the absorbing side. At a level against the move, prior day extremes or range edges, it is reversal context. Inside a trend, absorbing the pullback, it is continuation. Either way the entry is never the wall itself; it is aggression flipping at the level.
At what levels is absorption most reliable?+
Where passive players have a reason to defend: prior day high and low, range edges and value area boundaries, high-volume nodes and the session POC, and VWAP on early touches. Absorption printing far from any meaningful level is more often someone’s quiet exit than someone’s stand.
Where to go next
Absorption’s natural companions are the liquidity guide, which explains where the defended levels come from, and the delta divergence guide, which covers the trap of confusing the two readings of one-sided delta. And if you want the fingerprint flagged live while you train your eye on the cells, that is exactly what our Hammer Absorption indicator inside the Order Flow Suite was built to do.