Every chart you grew up with organizes volume by time: a bar per five minutes, a histogram at the bottom. A volume profile turns that sideways and asks the question that actually matters to a futures trader: not when did the volume trade, but at what prices. The answer draws a map of where the market has done business, where it refused to, and where it will care again.
This guide is the reading course and the playbook behind a real volume profile trading strategy: the anatomy (POC, value area, nodes), the profile types worth using, three rule-based setups with exact logic, and the failure conditions. It pairs naturally with the market profile guide, its TPO-based sibling, and like everything in this cluster it ends at the same place: the profile gives you the level, and the order flow tells you what to do when price gets there.
What is a volume profile?
A volume profile is a histogram of traded volume organized by price instead of time: for every price level, it shows how many contracts changed hands there. The longest row is the point of control, and the band holding roughly 70% of the volume is the value area, the market’s accepted range.
The premise underneath is auction logic. Markets spend most of their time negotiating around prices both sides accept, and volume piles up there. Prices one side rejects trade thin and fast. The profile records that negotiation permanently, which is why its features keep mattering days after they form: they are not lines someone drew, they are places the market demonstrably did or did not accept.
How to read volume profile: POC, value area, and nodes
The point of control (POC)
The POC is the single price with the most traded volume: the fairest price of the session by the only vote that counts, executed contracts. It acts like a gravity well inside balance, price rotating back to it repeatedly, and like a reference the next day: a session that opens above yesterday’s POC and stays there is telling you the market has re-priced. Point of control trading, in practice, is mostly about knowing which POC is in play: today’s developing one, yesterday’s, or a composite’s.
The value area, VAH and VAL
The value area is the band around the POC containing roughly 70% of the volume, bounded by the value area high (VAH) and value area low (VAL). The 70% convention comes from the normal distribution: one standard deviation around the mean covers about 68%, rounded up for a cleaner rule. Inside the value area, the market is negotiating; at its edges, it is deciding; outside it, one side has won the argument, at least temporarily.
High volume nodes and low volume nodes
Away from the headline levels, the profile’s texture matters. High volume nodes (HVNs) are bulges of acceptance: prices where the market spent time and did size. Price approaching an HVN tends to slow down and rotate, because both sides historically had business there. Low volume nodes (LVNs) are the gaps: prices the market rejected in a hurry. Price entering an LVN tends to keep moving until it reaches the next HVN, because there is no memory of acceptance to slow it down. If you already trade support and resistance, HVNs and LVNs are those levels with a volume-based reason attached.
Profile types: session, composite, and fixed range
- Session profile: one profile per trading day. The workhorse. Yesterday’s POC, VAH and VAL are the most-referenced levels in futures day trading.
- Composite profile: many sessions merged, a week, a month, a whole range. Slower to change, and its HVNs and LVNs mark the structural levels swing traders live on.
- Fixed range / anchored profile: drawn over a hand-picked segment, a trend leg, a consolidation, one news day. Ask a precise question, get a precise map. The anchoring logic is the same idea as anchored VWAP, applied to the whole distribution instead of the average.
A practical stack for volume profile futures trading on ES: composite for the big levels, yesterday’s session profile for today’s references, developing profile for the live auction. Three layers, one glance each.
Profile shapes: what the day is telling you
Volume profile trading strategy: three rule-based setups
A volume profile trading strategy has one honest core: the profile supplies locations with a reason to matter, and the entry still needs confirmation from the live auction. These three setups cover most of what professionals actually do with profiles, stated with exact logic instead of “acts as support and resistance.”
Setup 1: value area edge, back toward POC
- Context: rotational day, price inside value, D-shaped developing profile. This is range trading with a volume-based map.
- Trigger: price tests VAH or VAL and the order flow confirms rejection: responsive absorption at the edge, delta refusing to expand in the breakout direction.
- Entry, stop, target: entry on the rejection, stop one to two ticks beyond the high or low of the rejection probe itself (not the value area line, which the probe routinely overshoots), first target the POC. In balance, the POC is the magnet.
- Skip when: the day has trend character, price is accepting (not rejecting) beyond the edge, or the value area is still tiny early in the session.
Setup 2: the 80% rule
- Context: price opens outside yesterday’s value area, then re-enters it. (The canonical rule is defined off the open; many traders apply the same logic to intraday excursions, with correspondingly less pedigree.)
- The rule: if price re-enters and holds inside the value area for two consecutive 30-minute periods, the odds strongly favor a traversal of the entire value area. The “80%” is a rule of thumb inherited from the market profile tradition, not a measured constant; treat it as “high odds,” not a statistic.
- Entry, stop, target: entry on the confirmed re-entry (second 30-minute period holding inside), stop back outside the value area, target the opposite value area extreme.
- Skip when: re-entry happens on fading volume late in the day, or a scheduled news release sits between entry and target.
Setup 3: LVN break, HVN target
- Context: price approaching a low volume node with initiative behind it, often out of a double-distribution structure.
- Trigger: acceptance into the LVN with aggressive confirmation, stacked imbalances or expanding delta in the direction of travel. LVNs are corridors: rejected once, they move price fast when finally accepted.
- Entry, stop, target: entry on the confirmed break into the node, stop back on the origin side of the LVN, target the next HVN, where acceptance historically lives and the move has a reason to slow.
- Skip when: the “break” happens on thin overnight volume, or the LVN sits inside chop with no initiative anywhere.
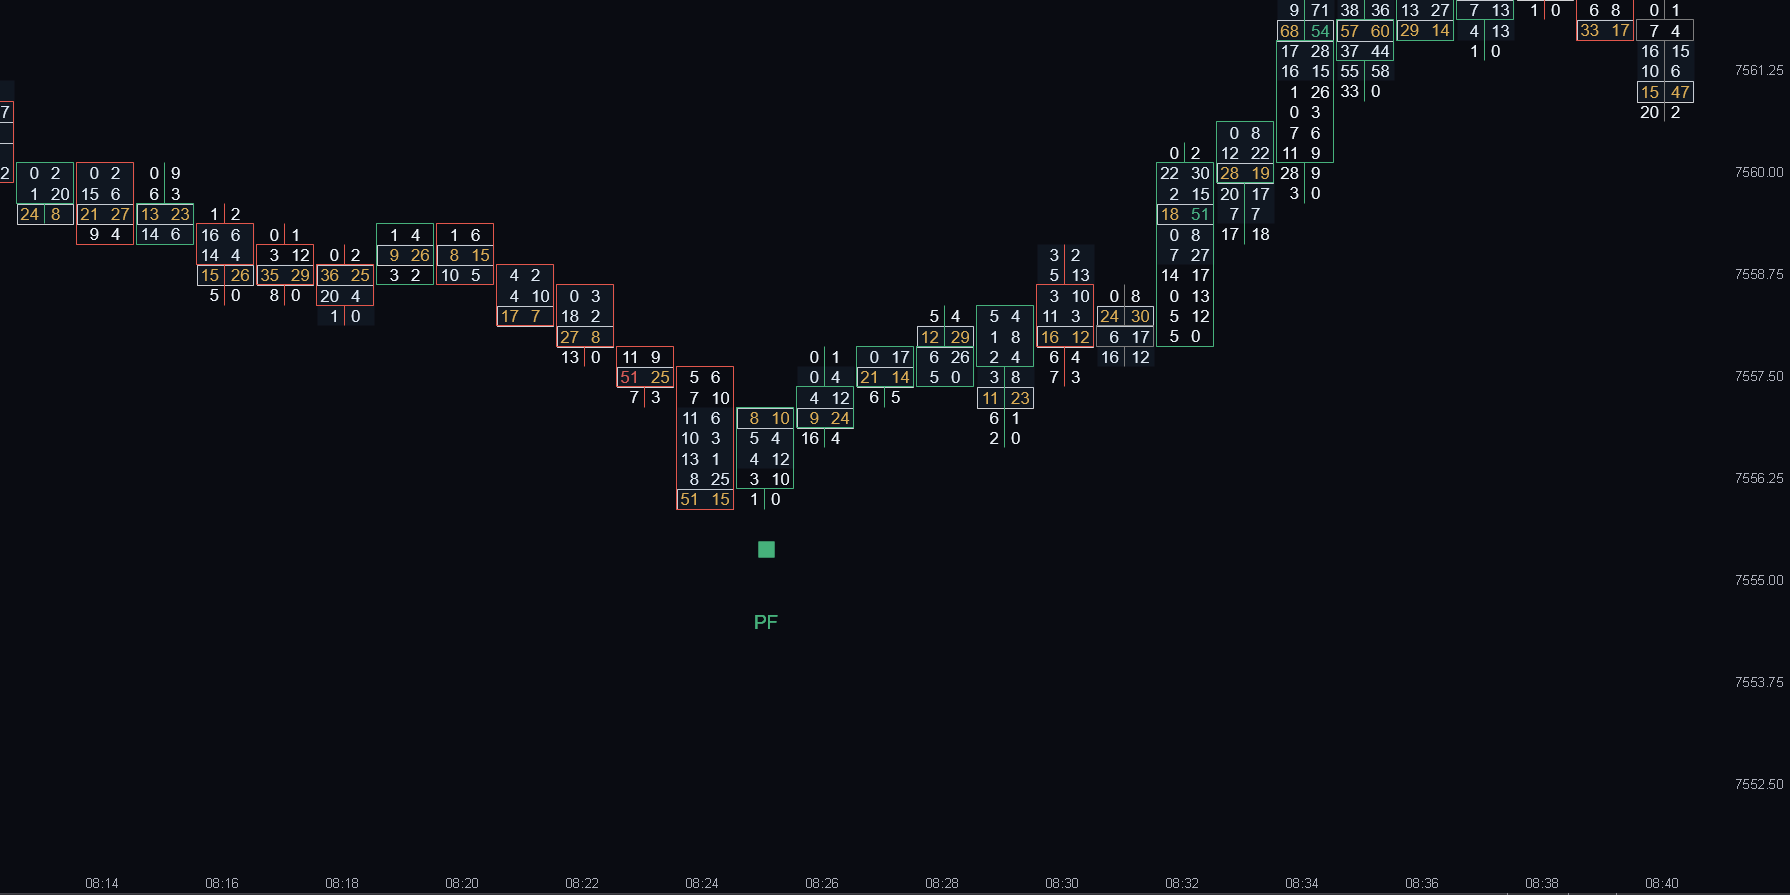
The profile never triggers a trade. It nominates the price; the footprint elects the trade. Every setup above is a location plus a live order flow condition, and skipping the second half is how profile trading gets its bad name.
Volume profile vs market profile
| Volume profile | Market profile | |
|---|---|---|
| Counts | Contracts traded at each price | Time at each price (30-minute TPO letters) |
| Answers | Where did the size trade? | Where did the auction linger? |
| Typical use | Volume-based levels: POC, nodes, value area | Day types, TPO structure, auction context |
Close cousins, one difference that matters: volume profile counts contracts at each price, while market profile counts time, stacking 30-minute letters (TPOs) to show where the session spent its attention. Volume answers “where did the size trade”; time answers “where did the auction linger.” They usually agree; when they disagree, price sat somewhere on low volume or did huge size in minutes, and both of those are information. The TPO framework, day types and all, has its own guide: market profile and TPO charts.
When the profile stops working
- Trend days ignore value. On a genuine trend day, price leaves the value area early and never negotiates. Responsive setups (1 and 2) are wrong all day; recognizing the day type by the first hour is the defense.
- Thin sessions build hollow profiles. A POC built on overnight Globex volume is a suggestion, not a level. Weight regular-hours profiles above holiday and overnight ones.
- News redraws the map. CPI and FOMC create new value in minutes; pre-news levels lose authority the moment the release hits, and the fixed-range profile from the news bar onward becomes the relevant map.
- Old levels decay. Like every level, profile references fade with each test and with time. Yesterday’s POC is a reference; last month’s untouched POC inside a composite HVN is background, not a trigger.
Frequently asked questions
What is the point of control (POC) in volume profile?+
The POC is the price with the highest traded volume in the profile’s period: the market’s fairest price by executed contracts. It acts as a magnet during balanced rotation and as a key reference afterward, with yesterday’s POC among the most-watched levels in futures day trading.
What are the value area high and low, and why 70%?+
The value area is the band around the POC containing roughly 70% of traded volume; its boundaries are the value area high (VAH) and value area low (VAL). The 70% convention approximates one standard deviation of a normal distribution (about 68%), marking the range both sides accepted as fair.
What is the 80% rule in volume profile trading?+
If price opens outside the prior value area, then re-enters and holds inside it for two consecutive 30-minute periods, the odds strongly favor price traversing the whole value area. The 80% figure is a traditional rule of thumb from the market profile literature, not a measured constant; intraday variants carry less pedigree.
What is the difference between volume profile and market profile?+
Volume profile counts contracts traded at each price; market profile counts time, stacking 30-minute TPO letters at each price. Size versus attention. They usually point at the same levels; disagreements flag prices where the market lingered without size, or did size without lingering, and both are worth noting.
What is the difference between high volume nodes and low volume nodes?+
High volume nodes are prices with heavy historical acceptance: price tends to slow and rotate there. Low volume nodes are rejected, thinly traded prices: price tends to travel through them quickly toward the next accepted area. HVNs are destinations and brakes; LVNs are corridors.
Where to go next
The natural pair is the market profile guide for the time-based half of the picture, and the order flow pillar for the confirmation layer every setup here depends on. And if you want the profile’s key levels tracked live, with POC role-changes flagged as they happen, that is what our POC Flip and Bullish/Bearish POC indicators inside the Order Flow Suite were built for.