Somewhere in almost every strong move there is a bar where one side simply ran over the other: buyers lifting three, four, five consecutive prices with triple the volume sellers could answer with. The footprint records that moment as a stack of imbalances, and it is the closest thing order flow has to a signature at a crime scene. Someone with conviction was here, and they left their prices behind.
This guide covers the mechanics precisely: the diagonal math behind an imbalance, why the 300% threshold is the default and when to change it, what makes stacked imbalances different from noise, how their zones behave as support and resistance, and the failure cases the tidy versions of this lesson leave out. It builds directly on how to read footprint charts; if diagonals are new to you, start there.
What is an imbalance on a footprint chart?
An imbalance on a footprint chart is a price where one side out-traded the other by a set ratio, usually 300%, measured diagonally: buy volume at each price against sell volume one tick lower. Stacked imbalances are three or more of them on consecutive prices, marking where aggression overwhelmed liquidity.
The diagonal is the part beginners miss. Buying at 5,290.50 is not compared with selling at 5,290.50; it is compared with selling at 5,290.25, one tick below, because that is the liquidity aggressive buyers actually consumed on the way up. The bid ask imbalance test runs one way for buy imbalances (ask versus the bid a tick lower) and the mirror way for sell imbalances (bid versus the ask a tick higher).
The threshold debate: 150%, 300% or 400%?
Every platform lets you tune the imbalance ratio, and the debate is older than it deserves to be. The honest summary:
- 300% is the default on ATAS and most footprint platforms, and it is the setting this entire series assumes. It marks genuine one-sided aggression without flooding the chart.
- Lower thresholds (150–200%) print more signals and more noise. They have a defensible use on very liquid, slow instruments where 3:1 prints are rare, but for ES, NQ and Gold they mostly manufacture clutter.
- Higher thresholds (400%+) print rarely and mean more when they do. Some traders run a second, stricter setting precisely to make the extreme prints stand out.
- The volume filter matters more than the ratio. Whatever the threshold, pair it with a minimum-volume filter so near-empty cells at bar extremes never print, like the 12× on thirteen contracts in Fig. 1.
Pick a setting, keep it for months, and let your eye calibrate to it. Retuning the threshold every week resets the pattern recognition you are trying to build.
Stacked imbalances: when aggression leaves a trail
A single imbalance happens somewhere on almost every bar; on its own it is trivia. The signal with teeth is the stack: three or more imbalances on consecutive prices, same side. One aggressive print can be anyone. Three in a row is a participant with size and intent, paying up through level after level and winning at each one.
Stacks matter in two tenses. In the present, they confirm initiative, the first of the three core reads from the order flow trading guide: aggression that is getting paid. A breakout that prints stacked imbalances through the broken level is structurally different from one that drifts through it. In the past tense, they leave a zone, and that is where the trading value concentrates.
Do stacked imbalance zones act as support and resistance?
Yes, and for a mechanical reason rather than a mystical one. The traders who built the stack are positioned at those exact prices. When the market trades back into the zone, they are underwater on a position they took with conviction, and the rational responses, defending the level or adding at better prices, both produce buying at the zone. A stacked-imbalance zone is support you can trace to specific, positioned participants.
Handling rules that keep the zones honest:
- Draw the zone across the imbalance prices, from the lowest to the highest print of the stack, and extend it forward.
- Fresh zones outrank tested ones. Each revisit consumes some of the defenders; the first retest carries the most information.
- Confirmation still applies. A retest that holds should show it in the flow: bids absorbing, delta stabilizing, ideally new buy prints off the zone. A zone entered blindly is a hope, not a read; watch the delta behavior at the touch.
- Structure first. If the idea of execution-derived zones sounds like SMC’s order blocks, the instinct is right: order blocks infer the zone from candle structure, stacked imbalances derive it from the actual executions. When both agree, the zone has two independent reasons to exist.
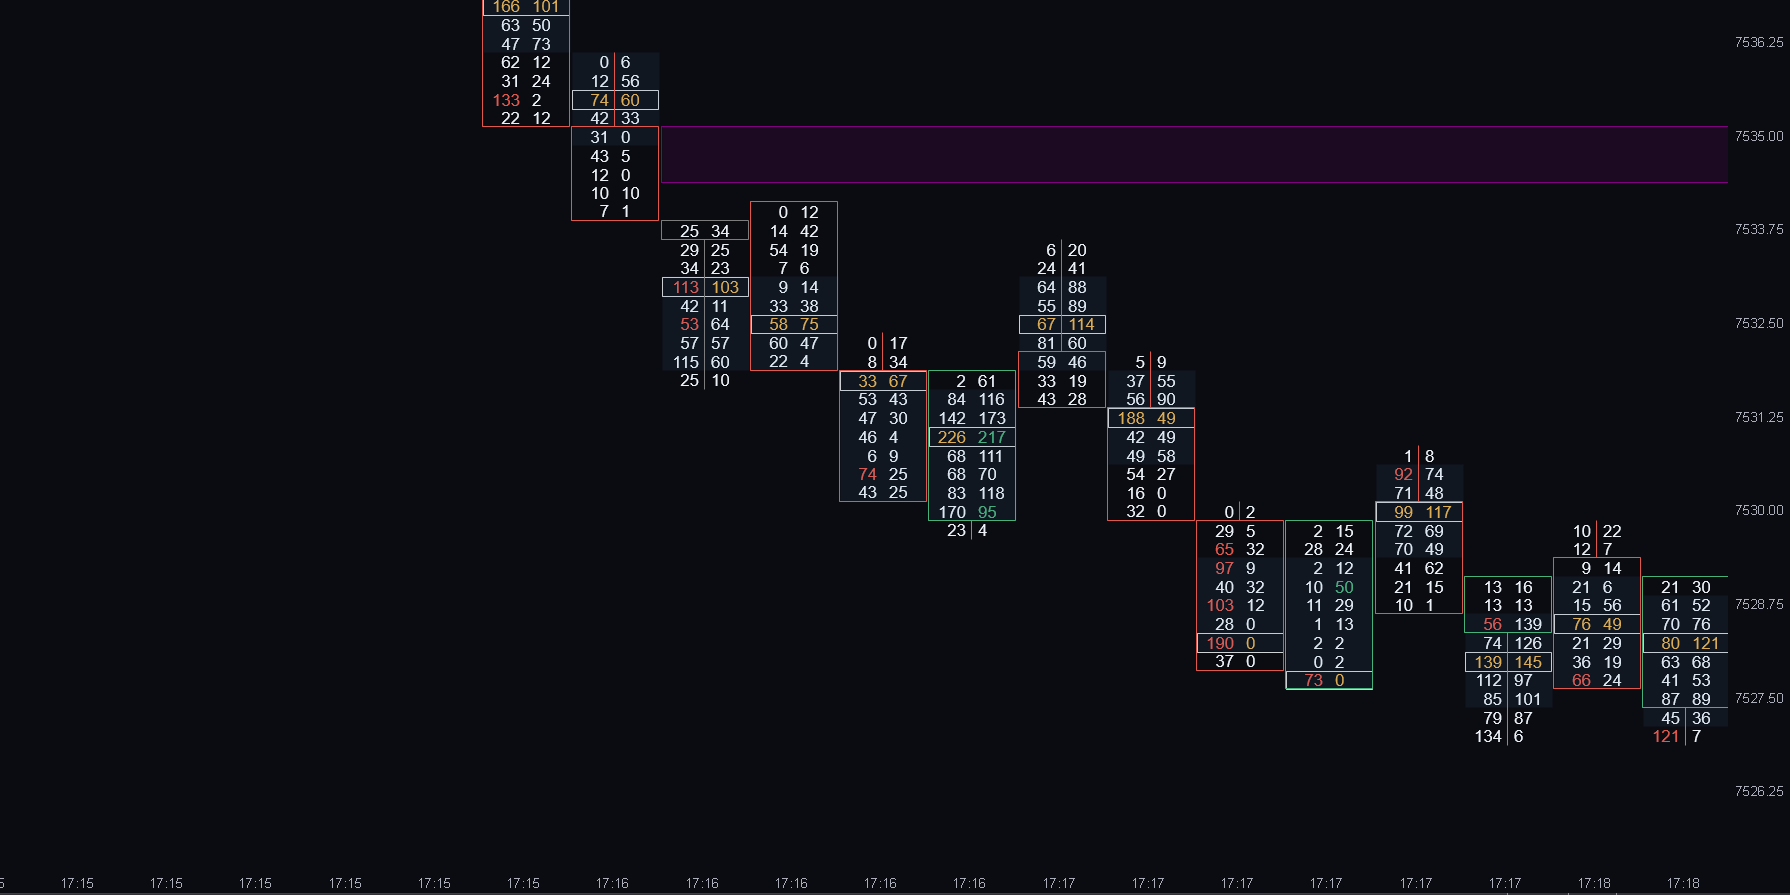
How to trade imbalances on a footprint chart
The decision framework is deliberately strict, because the raw signal fires constantly:
- Lone imbalance: no action. It is context at best. Log it mentally and move on.
- Stack at a meaningful location: candidate. A stack printing through a real level, a range edge, prior day extreme, value area boundary, is initiative worth trading with, either on the continuation or on the first retest of the new zone.
- Demand delta agreement. The bar delta should agree with the stack’s direction, and the bars after it should not immediately give the ground back. A stack the market instantly refunds was absorbed, not initiative.
- Enter on the zone behaving, stop beyond it. For retest entries: price enters the zone, holds, and prints opposing aggression fading. The stop goes past the far edge of the zone; if the defenders are gone, the premise is gone.
When stacks fail
The failure cases are exactly where the tidy explanations stop, so here they are:
- The absorbed stack. A stack prints into a bigger passive player and the move dies on the spot: heavy aggression, no follow-through, then rotation the other way. The aggressors who built the stack become the trapped side. This is the single most instructive failure, because the follow-through bars tell you almost immediately.
- Stacks against the higher timeframe. A beautiful 5-minute stack shorting into weekly support is a small player winning a battle inside a war they have already lost. Check one timeframe up before trusting any stack.
- News bars. CPI and FOMC bars print spectacular stacks in both directions within seconds. They are records of chaos, not intent; zones from news bars are unreliable until proven otherwise.
- Old zones. A stacked-imbalance zone from four sessions ago has mostly stopped meaning anything; the positions behind it have been managed, hedged or stopped. Prefer today’s and yesterday’s zones.
An imbalance is arithmetic. A stack is intent. A zone is memory. The trade only exists where all three line up with a location that matters, and the follow-through bars confirm the market agrees.
Footprint imbalances vs the quant “order flow imbalance”
One disambiguation, because search results mix these up. The academic and HFT literature uses order flow imbalance (OFI) for a different object: a microstructure signal computed from changes in the best bid and ask queues, used to model short-horizon price impact in quantitative research. Same words, different instrument entirely. What footprint traders work with is the footprint chart imbalance, the diagonal ratio of executed volume this guide covers, read manually at the trade level on the chart. If you arrived here researching the quant signal, this is not that guide; if you trade a footprint, the quant papers are not about your imbalances either.
Frequently asked questions
What is an imbalance on a footprint chart?+
A price where one side out-traded the other by a set ratio, measured diagonally: buy volume at each price against sell volume one tick lower (and the mirror for sell imbalances). At the default 300% threshold, a print means one side traded at least three times the other’s volume at that spot.
What are stacked imbalances in order flow trading?+
Three or more imbalances on consecutive prices, on the same side. A lone imbalance happens on almost every bar; a stack marks a participant with size paying up through several levels in a row, which confirms initiative in the moment and leaves a defendable zone at those prices afterward.
What percentage ratio counts as an imbalance?+
The common default is 300%: one side trades at least triple the other on the diagonal. Lower settings like 150–200% print more and mean less; 400%+ prints rarely and means more. The ratio always needs a minimum-volume filter, so tiny cells at bar extremes never print as meaningless imbalances.
Do stacked imbalances act as support and resistance?+
Yes, mechanically: the traders who built the stack hold positions at those exact prices and tend to defend them on a retest. Draw the zone across the stack’s prices and extend it forward. Fresh zones on the first retest are the reliable ones; old and repeatedly tested zones decay fast.
Is this the same as the quant order flow imbalance (OFI)?+
No. The quant OFI is a research signal computed from changes in the best bid and ask queues, used to model short-horizon price impact. Footprint imbalances are diagonal ratios of executed volume, read manually on the chart. Same words, different objects, different users.
Where to go next
Stacks are initiative; their mirror image is absorption, covered in the pillar’s three reads, and the deep version of reading a stack’s cells lives in the footprint chart guide. And if you would rather have every qualifying stack detected and its zone drawn forward automatically while you train the eye, that is precisely what our Delta Stack indicator inside the Order Flow Suite does.