
Volume Sequencing
Auto-draws support and resistance zones where aggressive buyers or sellers built genuine one-sided pressure into an extreme — so you stop reading raw clusters by hand.
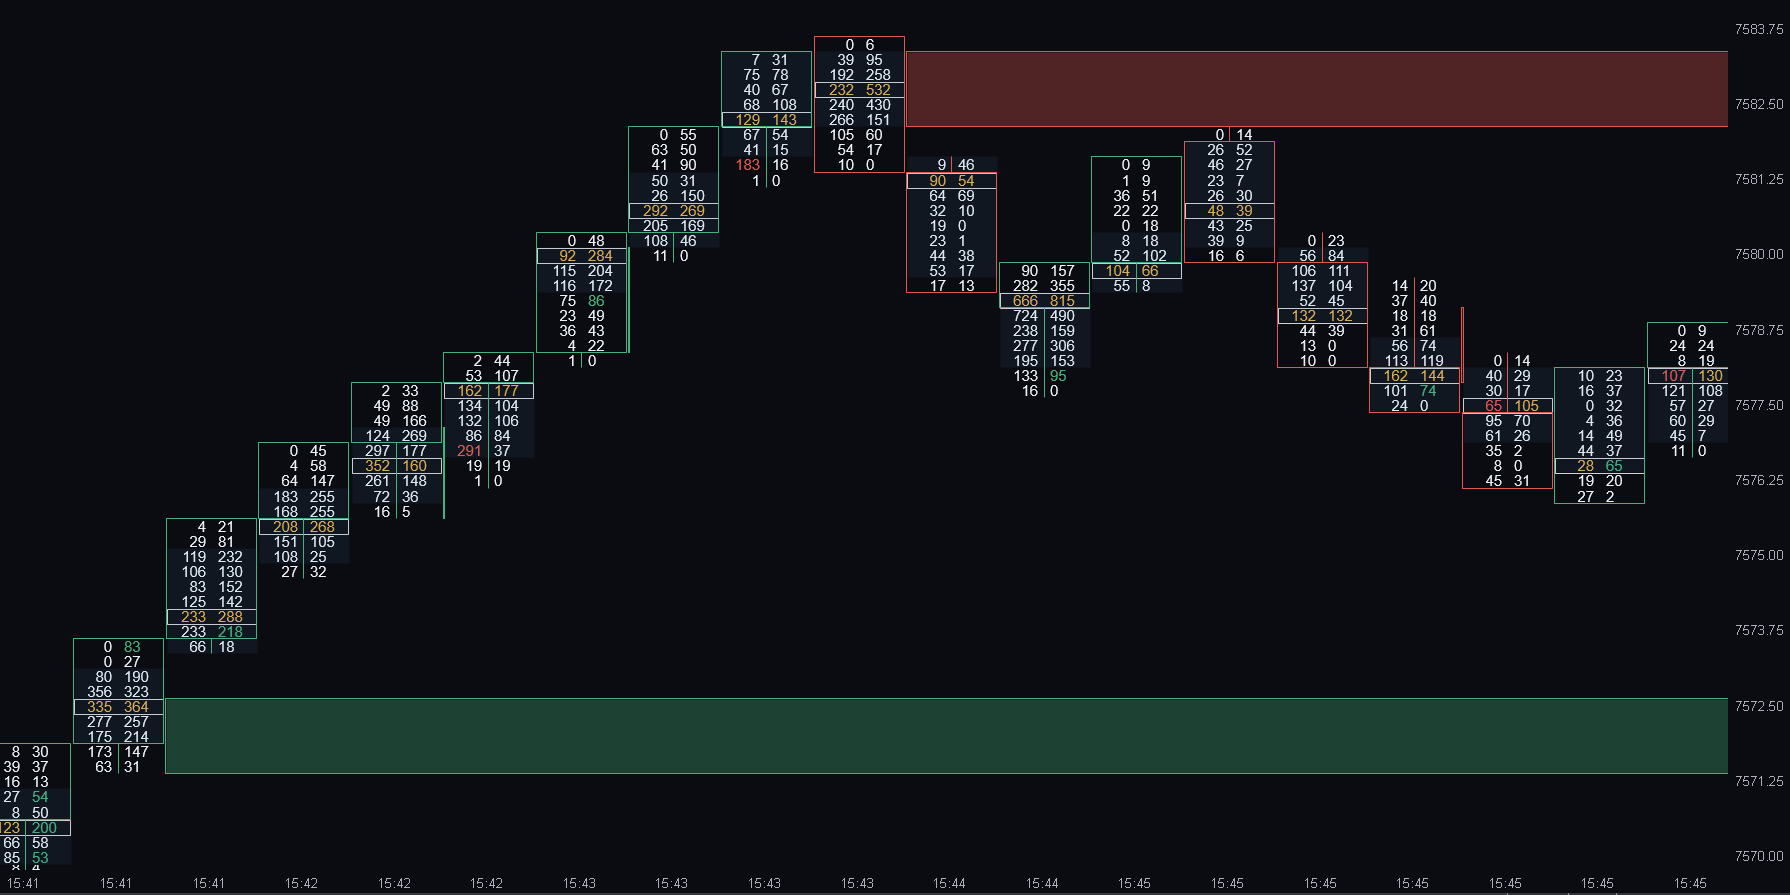
Real capture — ES footprint with Volume Sequencing running. Hover to inspect.
Footprints show you everything. That’s the problem.
Spotting where aggression is actually building a level means eyeballing hundreds of tiny cluster cells, bar by bar. The moments that matter — real buying pressure driving into a high, real selling pressure driving into a low — are easy to miss in the noise, and they’re exactly the levels price tends to respect later.
Volume Sequencing watches every bar’s footprint for you and turns those moments into clean, visible zones. You don’t read raw clusters manually; you watch how price behaves when it comes back to a level that genuinely mattered.
Objective zones from actual traded order flow.
Instant, rules-based zones
A zone only prints when the order flow meets strict, pre-defined criteria — so every drawn zone means the same thing, on every chart, every session.
Levels from real bid × ask runs
Support and resistance built from what buyers and sellers actually did — not price geometry or hand-drawn lines.
Tested vs untested at a glance
Zones extend to the right and lock the moment price re-enters them — a live read on which levels still haven’t been tested.
Direction-aware by default
Ask zones only on up-bars, bid zones only on down-bars — genuine one-sided pressure, not noise. A confluence layer that drops into your existing workflow.
Strict rules, no guesswork.
Volume Sequencing reads the complete footprint of every bar — the real traded bid × ask at every price — and applies a strict, fixed set of detection rules to identify genuine one-sided aggression. Nothing subjective, nothing discretionary: either the order flow qualifies, or no zone prints.
Zones are confirmed from completed bars and never repaint. Once drawn, a zone projects forward and locks the moment price returns to test it — so tested and untested levels are always obvious at a glance.
You stay in control of how strict it is: sensitivity, filtering, projection and colors are all yours to tune. The detection logic itself is our work — refined on live tape, and the reason the tool is worth paying for.
Settings you control
- Detection sensitivityStricter or looser zones
- Direction filterOn / off
- Extend zonesProject until tested
- Signal-bar outlineMark the detection bar
- Lookback windowKeep long charts fast
- Zone colorsBullish & bearish, fully custom
When it helps — and when it won’t.
Built for
- ✓Scalping and intraday order-flow trading on footprint/cluster charts
- ✓Objective S/R for entries, exits and targets — watch the re-test of a zone
- ✓Confluence with your own levels, VWAP or session marks
- ✓Liquid futures (ES, NQ, CL, GC…) and most crypto perpetuals
Not built for
- ✕Spot forex — no centralized volume means no footprint to read
- ✕Standalone entry signals — it marks zones; the trade decision stays yours
- ✕Higher-timeframe positioning — it’s an intraday tool
- ✕Ultra-thin instruments where a few contracts print meaningless runs
From checkout to chart in minutes.
Secure checkout
Pay securely by card — and tell us the email your ATAS platform logs in with.
We link your account
Volume Sequencing is granted to that ATAS account. No license keys, no files.
Open ATAS
It’s waiting in your indicators list — add it to any footprint or cluster chart.
Start trading
Zones draw automatically on your charts — nothing else to configure.
Questions, answered straight.
What data feed do I need?
Which chart types and timeframes work best?
Does it repaint?
Can I combine it with my other order-flow tools?
How does the 7-day free trial work?
Can I use it on more than one computer?
This is 1 of 15. Own them all.
Volume Sequencing is one piece of the Order Flow Suite — every indicator we make, and every one we release next, in a single one-time purchase.
Ready when you are.
One payment, yours for life — or test it free for 7 days on your own ATAS data first. No card up front, nothing to cancel.