Every chart you have ever looked at is a record of one thing: executed orders. Not opinions, not forecasts, not indicator values. Orders that actually traded. Order flow trading is the discipline of reading those executions directly, so that instead of inferring what buyers and sellers might be doing from the shape of a candle, you watch them do it.
This guide is the starting point for our entire order-flow curriculum. It explains what order flow actually is, the mechanics that make it readable, the tools that display it, and the three core reads that every setup in this discipline reduces to. It also covers, honestly, where order flow falls short and how long it takes to learn. Everything here applies to CME futures (ES, NQ, Gold) for reasons the guide makes clear.
Price doesn’t move because a line crossed another line. It moves because aggressive market orders consumed the passive limit orders resting at a price. Order flow trading is watching that consumption happen live, with numbers.
What is order flow trading?
Order flow trading is a method of making trading decisions from executed orders: who initiated each trade, at what price, and in what size. Instead of reading indicators computed from past closes, an order flow trader watches current buying and selling directly, as it happens inside each bar.
The distinction that makes this possible is the split between two kinds of participants at every price level:
- Passive traders rest limit orders in the book: “I’ll buy, but only at 5,290.00.” They provide liquidity and they set the menu of available prices.
- Aggressive traders send market orders that execute immediately against those resting orders: “buy me 50 now, whatever it costs.” They consume liquidity, and their aggression is what moves traded price.
Every trade that prints is a meeting of the two: an aggressor and a passive counterparty. When aggressive buyers consume all the sell limit orders at one price, the market ticks up to the next price where sellers are resting. That is how traded price moves. (Quotes can shift without a single trade too, when passive orders are cancelled rather than consumed. That is exactly why a visible wall is never a promise.) Order flow tools record which side initiated every one of those trades, and that record is what you learn to read.
How to read order flow: charts, indicators and the DOM
Reading executions needs displays built for it. Three tools do nearly all of the work, and each answers a different question. Traders group them loosely under the label order flow indicators, though only one of them is an indicator in the classic sense.
Footprint charts: what traded inside the bar
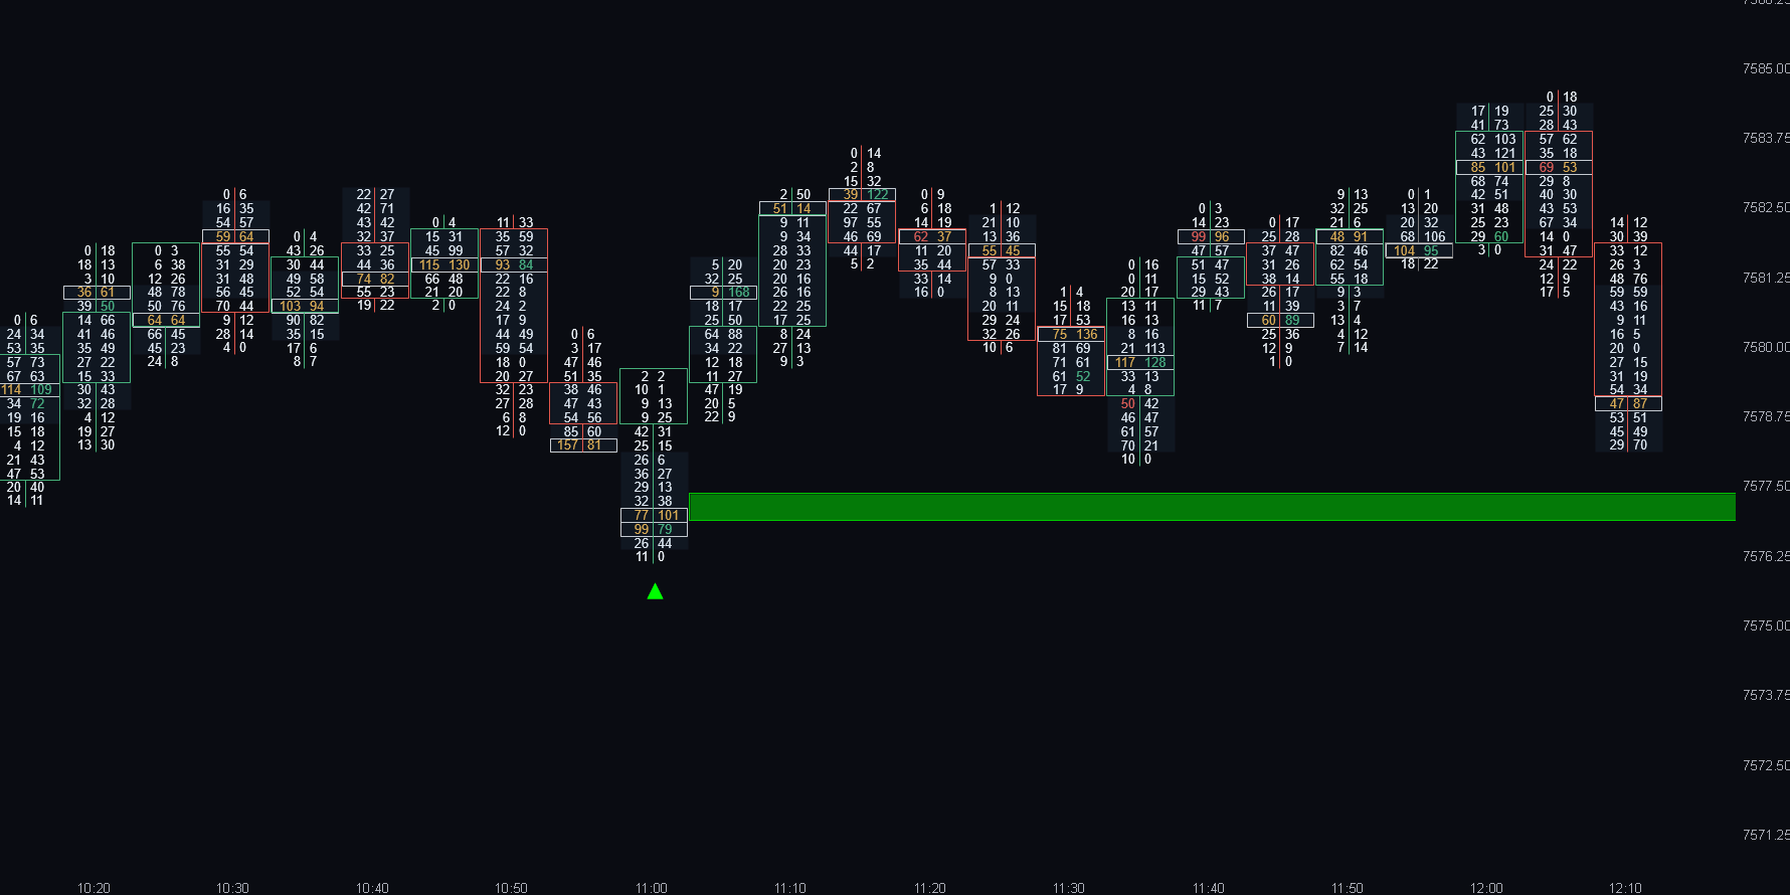
A footprint chart is a candlestick chart with the inside exposed: each bar becomes a column of cells, one per price, showing how much volume executed at the bid versus at the ask. It is the workhorse of order flow trading: imbalances, absorption and exhaustion are all footprint reads. It deserves its own guide, which walks a real bar cell by cell.
Delta and CVD: who is winning, net
Delta is ask volume minus bid volume: one number per bar summarizing net aggression. Cumulative volume delta (CVD) runs that total across the session, giving you a line you can compare against price. When price makes a new high but CVD doesn’t, buyers were less committed on the second push. That divergence is worth investigating, not trading automatically.
The DOM and the tape: the book, live
The depth of market (DOM) shows resting liquidity before it trades: the limit orders displayed above and below price. Displayed is the operative word. Iceberg orders show only a slice of their true size, so the real book is routinely bigger than the ladder suggests, which is one more reason absorption is confirmed by executed volume in the footprint rather than by how large a wall looks. Time & sales shows every execution the moment it prints. Together they are the rawest view of the market that exists: no aggregation, no bars, just the book and the tape. Tape reading is the oldest form of order flow analysis and still the most granular. It is also the most demanding, because the information arrives at market speed with no visual summary. That is why most traders start with footprints, which aggregate the same data into readable bars, and come to the DOM later.
Volume profile and market profile are order flow’s memory: they show where volume accumulated over hours or days, which tells you where to pay attention. Footprints and delta then tell you what’s happening when price gets there. Location first, execution second.
The three core reads of order flow analysis
Every order flow setup, whatever a course or an indicator calls it, reduces to one of three underlying situations. Learn to recognize these three and you can derive the rest yourself.
1. Initiative: aggression that gets paid
Heavy volume on one side and price making progress in that direction. Buyers lift the ask, the level breaks, they lift the next one. In the footprint this shows as imbalances stacking in the direction of travel. Initiative tells you the aggressors are being rewarded. The read is continuation, and the mistake to avoid is fading it because price looks extended.
2. Absorption: the wall that doesn’t move
Heavy volume on one side and price going nowhere. Aggressive sellers hammer a level and it refuses to break, because someone passive is buying everything they sell. High volume with no progress means the aggressors are losing. Absorption is the most valuable read in order flow precisely because a candlestick chart cannot show it at all. On the candle it is just a boring flat bar; in the footprint it is a war being lost.
3. Exhaustion: the move running dry
Volume shrinking while price grinds to a new extreme. The last push into a high happens on a fraction of the participation the move started with, because nobody with size wants to pay these prices anymore. Exhaustion does not call the top by itself. Combined with a level worth reversing at, it is the difference between guessing a reversal and reading one.
| Read | Volume | Price progress | Who’s winning | Typical response |
|---|---|---|---|---|
| Initiative | High | Follows through | Aggressors | Trade with the move |
| Absorption | High | Stalls | Passive side | Look for rejection |
| Exhaustion | Fading | Stalls at extreme | Nobody; fuel is gone | Prepare for reversal, with confirmation |
A worked example: reading one level from start to finish
Here is how the pieces fit together in practice. No hindsight-perfect chart, just the sequence of decisions as they actually happen.
The location. It’s 10:15 on ES. Yesterday’s low sits at 5,282.00, a level every participant can see and exactly what makes it worth watching. Price has been selling off toward it for twenty minutes. Structure alone offers two guesses: it breaks, or it holds. Fifty-fifty. This is where most technical traders either gamble or stand aside.
The approach. On the footprint, the selling into the level looks healthy at first: wide negative delta bars, sell imbalances stacking, initiative in full effect. If you were looking for a reason to buy early, the flow says don’t.
The tell. The next three bars change character. Volume stays heavy, the heaviest of the morning, but price stops making progress. 5,282.25, 5,282.00, 5,282.25 again. Sellers are hitting the bid as hard as ever and the low won’t break: someone passive is buying everything they sell. That is absorption, and the delta confirms it with deeply negative bars that get no downside follow-through. Aggressive sellers are trapped in losing trades, and every one of them is a future buyer, because their stops are buy orders.
The confirmation. You do not buy the first sign of absorption, because walls can pull. You wait for the flow to flip: a bar where buy imbalances print at the lows and delta turns positive while price lifts off the level. Initiative, now pointing up, aimed at the trapped sellers’ stops overhead. That bar is the entry trigger; the absorption low is the invalidation. If price trades back below the wall, the read was wrong and the trade costs one clean stop.
The point. Structure supplied the level. Order flow supplied the sequence (initiative down, absorption at the level, initiative back up) that turned a fifty-fifty guess into a trade with a defined story and a defined invalidation. That sequence, at different levels and in both directions, is a large share of what professional order flow trading actually is.
Order flow vs technical analysis
The honest answer to “which is better” is that they answer different questions, and the traders who do this well use both in a fixed order.
Technical analysis (market structure, price action, support and resistance) is a location tool. It tells you where the interesting prices are: the level everyone can see, the range boundary, the prior day’s value area. Order flow is a confirmation tool. It tells you what is actually happening when price arrives at those locations: is the level being defended (absorption), steamrolled (initiative), or approached on fumes (exhaustion)?
Structure gives you the where. Order flow gives you the whether. Trading order flow without levels means drowning in noise; trading levels without order flow means guessing at every touch.
This is also why order flow is not a shortcut around learning to read a chart. If you can’t mark a sensible level yet, footprints will just be faster confusion. Learn structure first, then use order flow to stop paying for every false breakout that structure alone can’t filter.
Why order flow traders work in futures
Order flow data is only as good as the tape it comes from, and this is where market choice stops being a preference and becomes a requirement.
- CME futures are centralized. Every ES, NQ and Gold contract trades through one exchange with one order book. The volume you see is all of the volume, and every execution in the central book is tagged buyer- or seller-initiated. The tape is complete and trustworthy.
- Spot forex has no central tape. Trading is scattered across banks and brokers; your “volume” is your broker’s slice, which may be a rounding error of the real market. Order flow tools on spot forex read a shadow, not the market.
- Crypto sits in between. Centralized per exchange, but liquidity is fragmented across venues. Order flow works; you are just reading one room of a larger building.
This is why every example in our guides is ES, NQ or Gold: not habit, but data quality. If you want to trade order flow seriously, a regulated futures market with a single consolidated book is where the discipline actually functions as designed.
Order flow trading for beginners: a realistic path
Here is the part vendor marketing leaves out: order flow has a real learning curve. Plan for it and it’s very manageable; ignore it and you’ll conclude the tools “don’t work” right around the time they were about to start making sense.
- Learn structure first. Be able to mark levels and read market structure before adding execution data. Order flow confirms decisions; you need decisions to confirm.
- One market, one setup. Pick one instrument (ES is the standard choice for its liquidity) and one read. Absorption at a marked level is the classic starter. Ignore everything else until it is boring.
- Sim trade for two to three months. Not because paper profits mean anything, but because footprint reading is pattern recognition, and pattern recognition needs reps without tuition costs. Trade the open, journal every read, review weekly.
- Add tools one at a time. Footprint first. Delta and CVD when footprints feel readable. The DOM last. Ten tools on day one is how you learn none of them.
- Expect three to six months before order flow reads feel automatic rather than effortful. That is normal, and it is faster than most traders took to unlearn their indicator stack.
If your interest is fast intraday execution specifically, our order flow scalping guide builds a complete playbook on top of the foundations in this article.
The mistakes that cost beginners the most
Six patterns account for most of the tuition new order flow traders pay. All of them are avoidable on day one:
- Reading flow in the middle of nowhere. Order flow is only meaningful at prices that matter. An imbalance in the dead center of yesterday’s range is trivia; the same imbalance at a session low is information.
- Treating every divergence as a signal. CVD diverges from price constantly on lower timeframes. A divergence is a reason to pay attention, not a reason to click.
- Buying the wall. Absorption is only proven after the flow flips. Passive walls pull; entering because the level “looks defended” before aggression confirms is how absorption trades become falling knives.
- Fighting initiative because price is “too high”. Stacked imbalances with follow-through mean the aggressors are being paid. Extended is not a signal; exhaustion is.
- Tool overload. Footprint plus DOM plus three delta studies plus two profiles on day one produces paralysis, not insight. One display, one read, mastered before the next is added.
- Skipping the journal. Footprint reading is pattern recognition, and pattern recognition without a feedback loop is just staring. Screenshot every read, note what you expected, review what happened.
Where order flow falls short
We sell order flow tools, so take this section as the disclosure it is: the discipline has limits, and knowing them is part of learning it.
- It doesn’t predict. Order flow describes the present tense with extraordinary clarity. It does not tell you what happens next. Absorption can fail. Stacked initiative can reverse on the next news print. You are trading probabilities with better information, not certainties.
- It’s noisy on small timeframes without context. Every bar contains some imbalance. Without a level that matters, order flow reads are answers to questions nobody asked.
- News overrides everything. During CPI or FOMC, resting liquidity vanishes and the book rebuilds in seconds. Order flow reads during scheduled releases are a different, harder game.
- It demands attention. This is an active, screen-on discipline. If you want signals to check twice a day, order flow is the wrong instrument, with or without our tools.
Frequently asked questions
What is order flow trading and how does it work?+
Order flow trading is making decisions from executed orders: which side initiated each trade, at what price, in what size. It works because traded price moves when aggressive market orders consume passive limit orders, and tools like footprint charts record exactly that, in real time.
Is order flow trading better than technical analysis?+
It answers a different question. Technical analysis locates the prices worth watching; order flow shows what buyers and sellers actually do when price gets there. Used together, location first and confirmation second, each covers the other’s blind spot. On its own, neither is sufficient.
What tools do you need for order flow trading?+
A platform that displays footprint charts, delta/CVD, and a DOM, connected to real futures market data. ATAS is what we build for and what every screenshot in these guides comes from. Indicators that mark footprint patterns automatically, like our Order Flow Suite, are a convenience layer, not a requirement: everything they mark can be read manually.
Does order flow trading work in forex?+
Not reliably on spot forex: there is no central exchange, so no complete tape exists and volume data is broker-specific. Order flow needs a consolidated order book, which is exactly what CME futures provide (including currency futures like 6E, if FX exposure is what you want).
What is delta in order flow trading?+
Delta is buy-initiated volume minus sell-initiated volume: executions at the ask minus executions at the bid. Positive delta means buyers were more aggressive in that bar; negative, sellers. Cumulative volume delta (CVD) sums it across the session, and divergences between CVD and price are among the most-watched order flow signals.
Where to go next
This pillar gave you the map; the rest of the cluster covers each territory properly. The natural next step is learning to read footprint charts, the display where initiative, absorption and exhaustion become visible, followed by CVD for session-level context. And when you want the concepts marked live on your own chart while you learn, that is precisely what the Order Flow Suite was built for.