A candlestick tells you where price went: open, high, low, close, four numbers per bar. What it cannot tell you is who made price go there, how hard they fought, and whether the winning side was running out of ammunition at the finish. Footprint charts exist to answer exactly those questions, and learning to read them is the single most concrete skill in order flow trading.
This guide teaches you how to read footprint charts, cell by cell: what each number means, how professionals scan a bar in seconds, and the handful of patterns worth knowing first. By the end, you will decode a complete footprint bar on your own, which is precisely the exercise most guides on this topic skip.
What is a footprint chart?
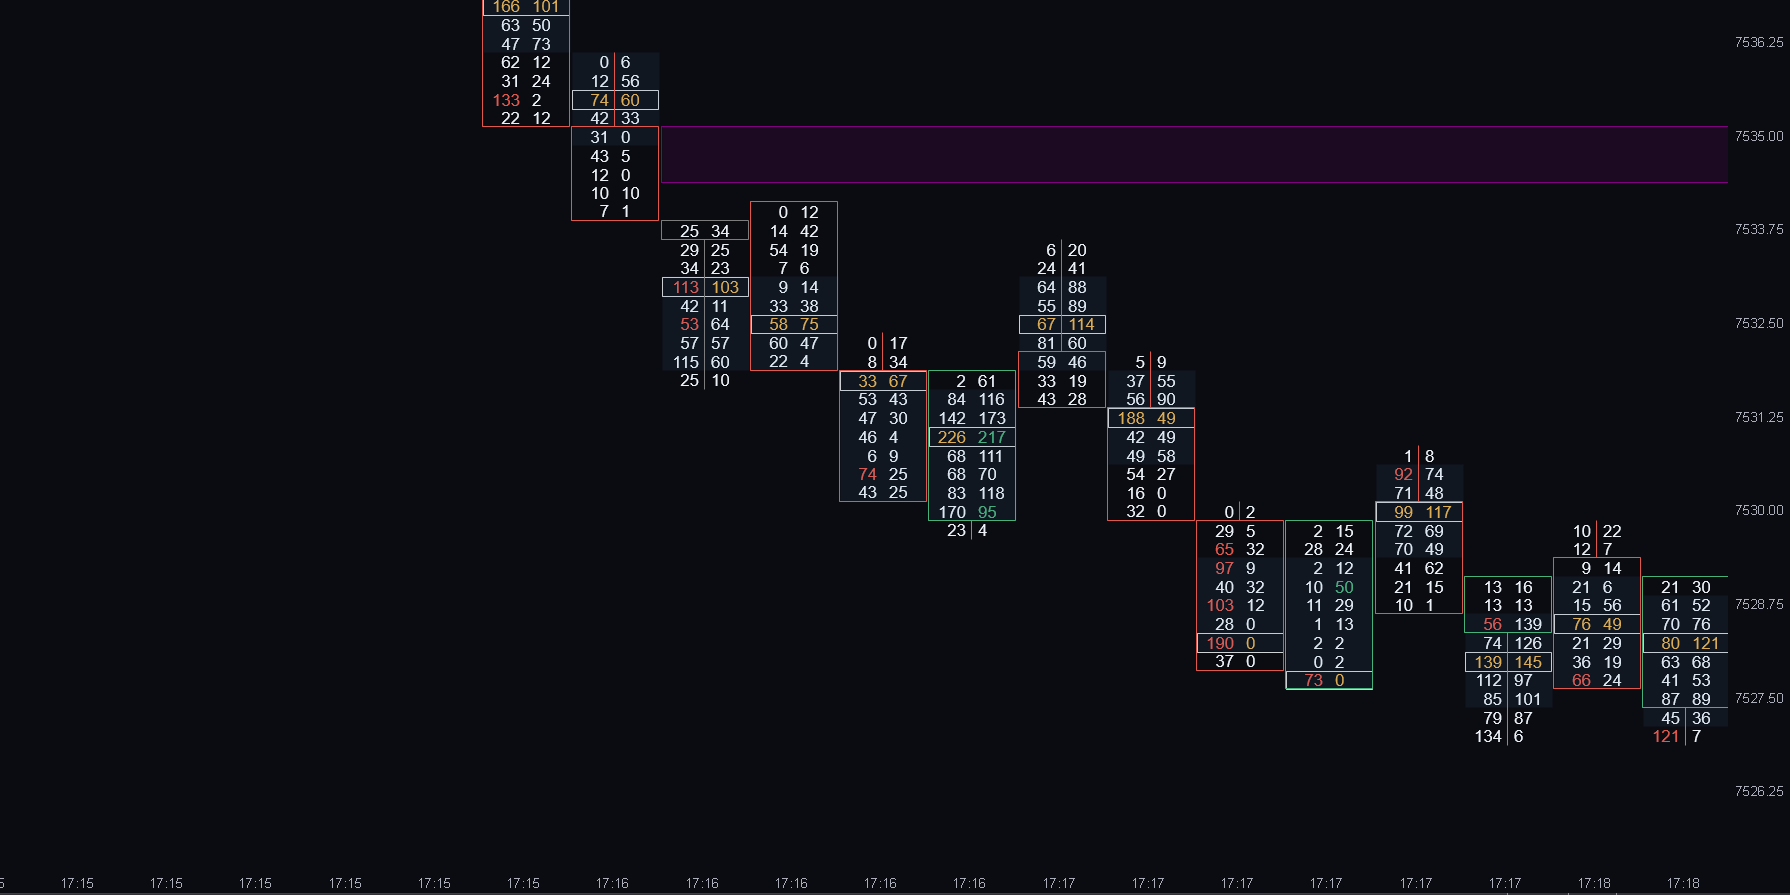
A footprint chart is a candlestick chart with the inside exposed. Each bar becomes a column of cells, one per price level, and every cell shows how much volume sold at the bid versus bought at the ask. Instead of four prices per bar, you see the full battle that produced them.
The comparison makes the difference obvious:
| Candlestick chart | Footprint chart | |
|---|---|---|
| Shows | Open, high, low, close | Executed volume at every price, split by aggressor side |
| Answers | Where did price go? | Who pushed it there, and at what cost? |
| Best for | Structure, levels, context | Confirmation at the levels that matter |
| Blind spot | Everything inside the bar | Noise, if read without levels |
Neither replaces the other. The workflow that works is the one from our order flow pillar guide: mark your levels on the candle chart, then read the footprint only when price gets there.
How to read a footprint cell: bid, ask, and the diagonal
Every cell prints two numbers. The left number is volume that traded at the bid: aggressive sellers accepting the lower price. The right number is volume at the ask: aggressive buyers paying up. The convention is sell × buy, and once that clicks, a footprint stops looking like a spreadsheet and starts looking like a fight, scored round by round.
The subtlety that separates correct reading from naive reading is the diagonal. You do not compare bid and ask at the same price; buying at 5290.50 competes with selling at 5290.25, one tick lower, because that is how aggression actually consumes the book. Compare the ask at each price against the bid one tick below it. When one side is three times larger or more, that cell prints an imbalance.
How to read a full footprint bar, cell by cell
Here is the scan professionals run on every bar at a level of interest. It takes them seconds; it will take you a minute at first. Work through the five steps on the annotated bar below.
- Find the POC. The point of control is the price with the most total volume in the bar, usually highlighted by the platform. That is where the battle happened.
- Read the delta. The footer number is buy volume minus sell volume for the whole bar. It tells you which side was more aggressive, net.
- Scan the diagonals for imbalances. Cells where one side tripled the other show where aggression actually overwhelmed liquidity.
- Check the extremes. A near-zero tip means the push ended cleanly: nobody was left to trade there. Heavy volume right at the high or low is unfinished business, and price often returns to it.
- Ask whether price followed the aggression. Big positive delta and a strong close: initiative. Big delta and no progress: someone absorbed it, and the aggressors are in trouble.
You never trade a footprint bar in isolation. The bar above earns a trade only if it prints somewhere that matters: a level from your candle chart, the edge of a range, yesterday’s value area. Location first, execution second.
Footprint chart types and the settings that matter
Platforms render the same execution data several ways, and the labels confuse beginners more than the data does:
- Bid × ask footprint is the display this guide teaches: two numbers per cell, aggression visible by side. Start here.
- Delta footprint prints one number per cell, the difference between the two sides. Cleaner to scan, but it hides absolute size: +5 could be 105 versus 100 or 5 versus 0, and those are different markets.
- Volume footprint prints total volume per price with no side split. Useful for spotting the POC and volume clusters at a glance, useless for reading aggression.
Only two settings deserve attention early. The imbalance threshold defaults to 300% on most platforms, including ATAS; leave it there until you have months of screen time, because tuning it to show more signals is how beginners manufacture noise. Platforms also pair the ratio with a minimum-volume filter, so near-empty cells at bar extremes, like the 3 × 1 tip in Fig. 2, never print as meaningless 300% “imbalances”. And bar type: time bars (5-minute) or tick bars (2,000 ticks on ES) both work, as long as cells stay readable. If the numbers blur together, your bars are too small.
Reading delta on a footprint chart
Delta compresses the whole bar into one number: buy volume minus sell volume. In Fig. 2 the delta is +430, which is the fastest possible summary of who was more aggressive. Platforms show it as a footer under each bar, and many traders read the delta row before anything else.
Two delta habits are worth building early. First, judge delta against the bar’s total volume: +430 on 1,566 contracts is meaningful, while +430 on 20,000 is noise. Second, watch what price does with the delta. A bar with strongly positive delta that closes weak is a warning that buyers are pouring volume into a wall; that mismatch is the seed of delta divergence, which gets a full guide of its own.
Imbalances and stacked imbalances
An imbalance is a diagonal ratio of 300% or more: one side of the fight overwhelming the other at a specific price. A single imbalance happens constantly and means little. The pattern that matters is the stack: three or more imbalances on consecutive prices, on the same side. A stack marks the exact prices where one side committed serious size and won.
Stacks matter twice. In the moment, they confirm initiative: someone with conviction is lifting every offer in their path. After the fact, they leave zones: when price returns to a stack of buy imbalances, the traders who bought there tend to defend their entries, which is why stacked-imbalance zones behave like support and resistance you can trace to actual participants. The full mechanics live in the imbalances guide.
The extremes: clean finishes and unfinished business
The top and bottom cells of a bar carry disproportionate information, because extremes are where auctions succeed or fail.
- A clean finish prints tiny volume at the very tip, like the 3 × 1 at the high of Fig. 2. The move ended because participation ran out, and the extreme tends to hold.
- Unfinished business is the opposite: hundreds of contracts trading right at the high or low. An auction that busy rarely ends there, and price has a well-documented habit of revisiting fat extremes to finish the job.
- High volume with zero progress at an extreme is absorption: aggressors unloading into a passive wall that will not move. It is the strongest reversal context a footprint can show, and it gets its own guide.
How to practice reading footprints
Footprint chart trading is a pattern-recognition skill before it is anything else, and the training plan is short:
- One market. ES is the standard classroom: deep, orderly, and every guide in this series uses it.
- Readable bars. Start on 5-minute or 2,000-tick bars. One-minute footprints on a fast day are an eye exam, not an education.
- Platform. You need software that renders bid × ask footprints with POC and delta. ATAS is what we build for and what every screenshot here comes from; the reading skill itself transfers to any footprint platform.
- Sim, with a journal. Two months of screenshotting bars at your levels, writing one sentence on what you expected, and reviewing weekly beats any course. If your goal is fast execution on these reads, the order flow scalping guide is the follow-up.
What footprint charts can’t tell you
We build footprint tools for a living, so believe us when we list the limits plainly:
- No context, no meaning. A perfect stack in the middle of nowhere is trivia. Footprints answer “what is happening here?”; your levels decide where “here” deserves the question.
- Hindsight bias is brutal. Every reversal shows a beautiful footprint after the fact. The discipline is reading left to right in real time, which is why sim reps matter more than theory.
- Thin markets lie. Footprints on illiquid contracts or dead sessions print dramatic ratios on meaningless size. Stick to liquid markets and active hours.
- It is a magnifier, not a system. Footprints sharpen entries and exits around a plan. They do not replace the plan.
Frequently asked questions
What is a footprint chart and how is it different from a candlestick chart?+
A footprint chart is a candlestick chart with the interior exposed: each bar shows executed volume at every price, split into sell (bid) and buy (ask) sides. A candlestick shows only open, high, low and close; the footprint shows who traded, where, and how aggressively inside the bar.
How do you read bid vs ask volume on a footprint chart?+
Each cell prints sell × buy: volume hitting the bid on the left, volume lifting the ask on the right. Compare diagonally, the ask at one price against the bid one tick lower, because that is how aggression consumes liquidity. Ratios of 3:1 or more print as imbalances.
What does delta mean on a footprint chart?+
Delta is buy volume minus sell volume for the bar: positive means buyers were more aggressive, negative means sellers. Judge it against total volume, and against what price did. Strong delta with no price progress signals absorption; delta falling while price rises is a divergence worth investigating.
What is a stacked imbalance and how do you trade it?+
A stacked imbalance is three or more consecutive prices where one side out-traded the other by 300% or more on the diagonal. It confirms initiative in the moment, and the prices it covers become a zone: traders who committed there tend to defend it on a retest, like participant-built support or resistance.
Do footprint charts work on all markets, and which platforms show them?+
They need complete, centralized executed-volume data, so CME futures like ES, NQ and Gold are ideal. Spot forex has no central tape, which makes its footprints unreliable. You need a platform that renders bid × ask footprints; ATAS is the one we build for, and the reading skill transfers anywhere.
Where to go next
You can now decode what most traders scroll past. The natural next steps are the two patterns this guide only introduced: imbalances and the zones they leave, and absorption at the extremes. And if you would rather have the diagonal math, the stacks and the clean finishes marked for you in real time while you build the manual skill, that is exactly the job of the Order Flow Suite.