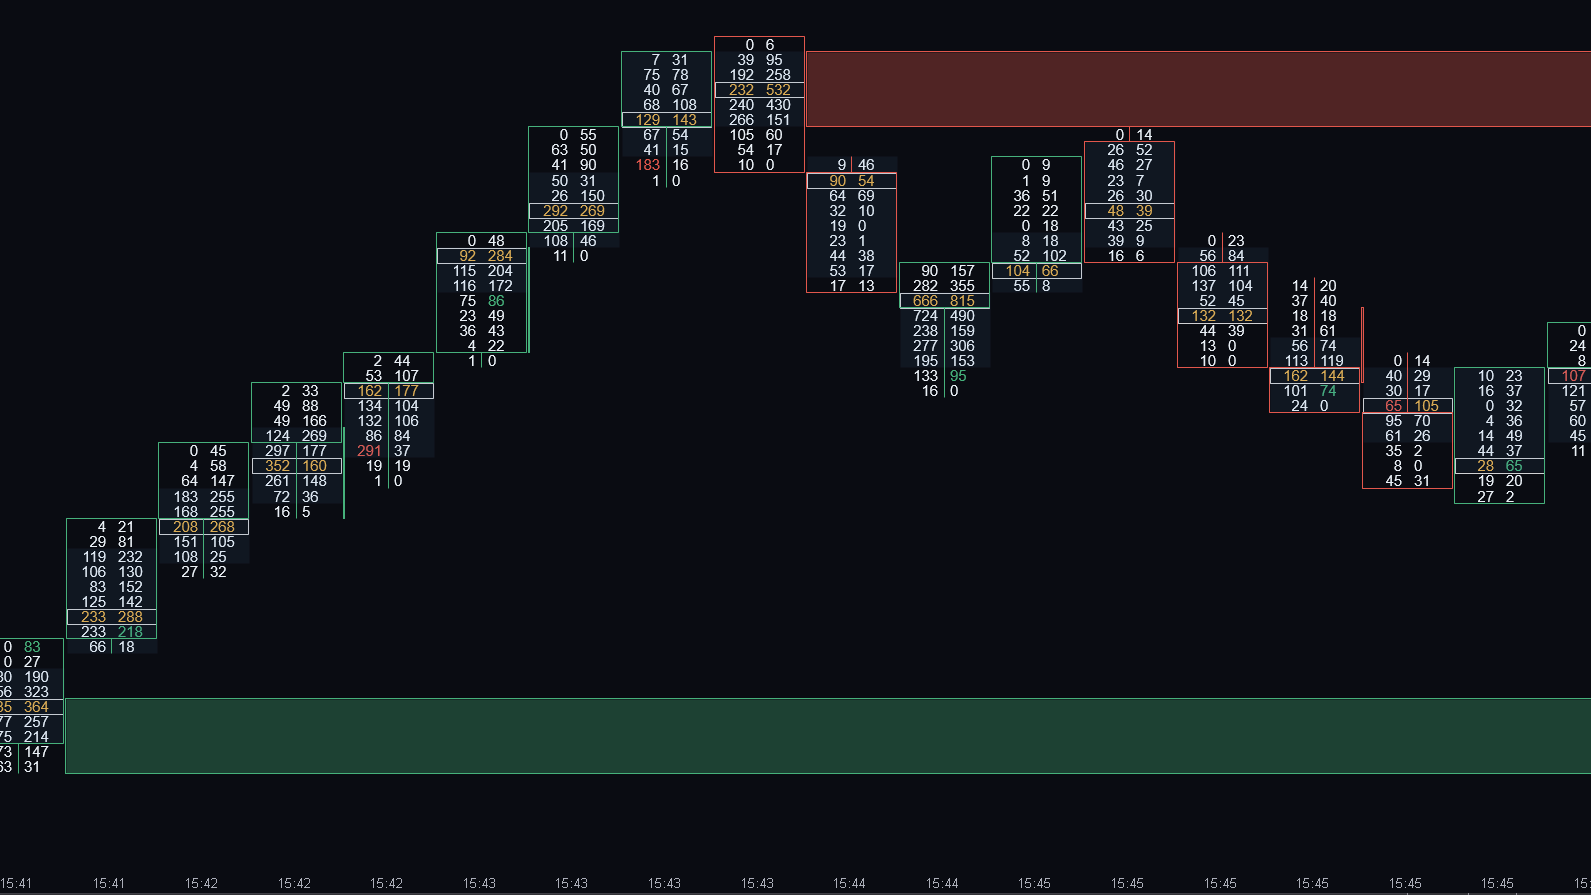
Volume Sequencing
Track pressure building bar after bar
Reveals where buyers or sellers stacked volume into an extreme — before it becomes obvious on a standard chart.
Learn more →
Professional order flow indicators for ATAS that automatically reveal hidden market behavior — spend less time interpreting charts and more time executing with confidence.
Every indicator focuses on one specific market behavior. Build your toolkit one tool at a time — or unlock the complete suite and get everything.
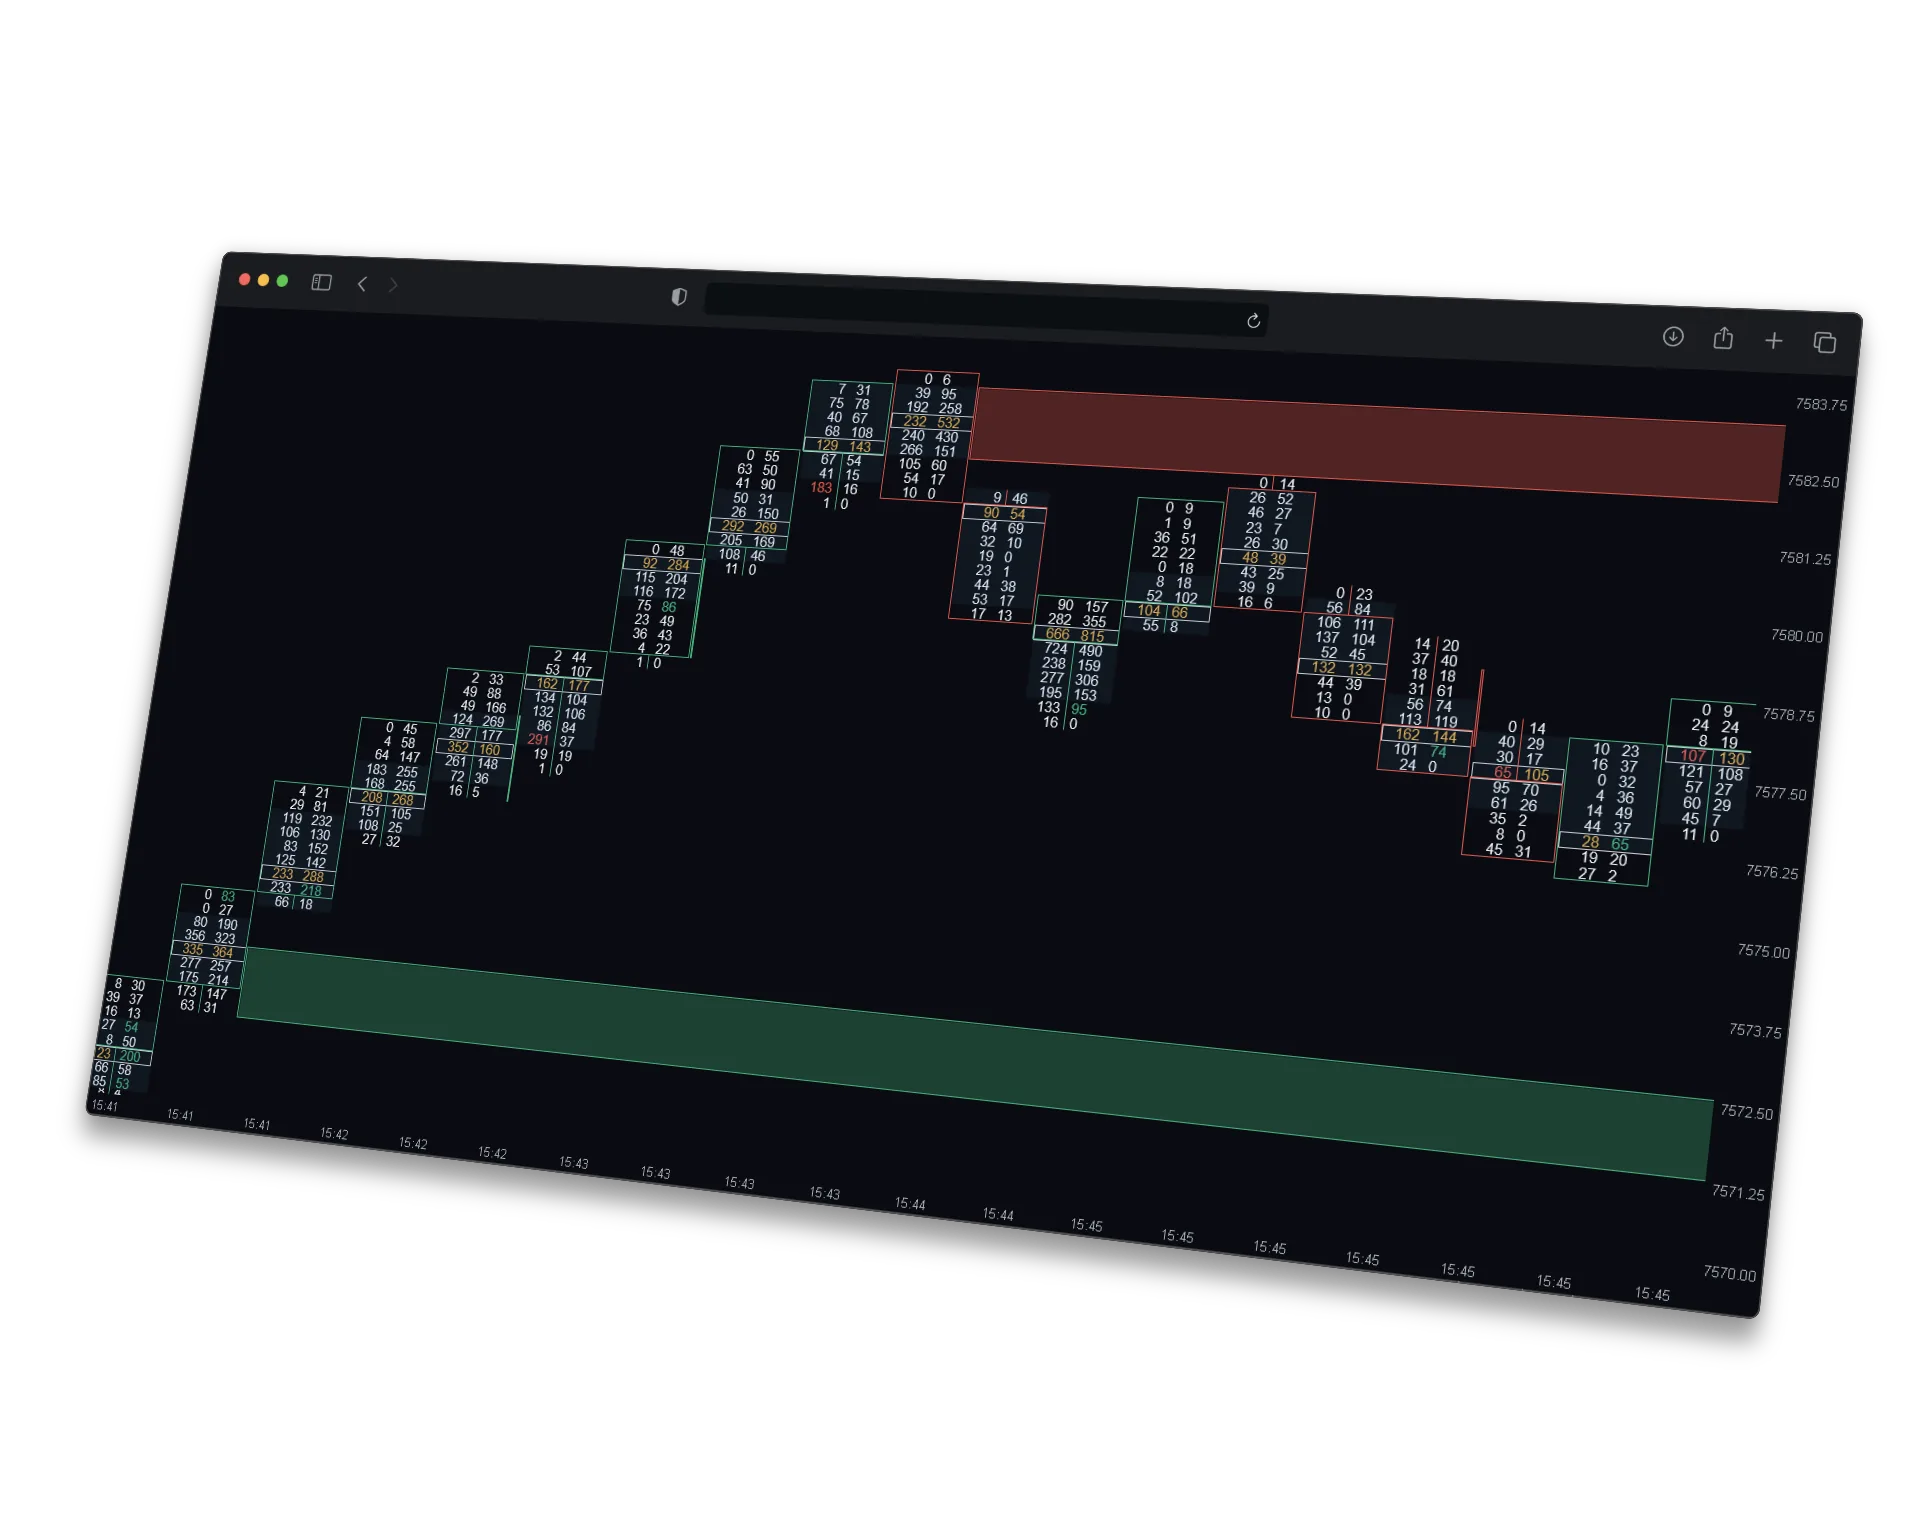
Track pressure building bar after bar
Reveals where buyers or sellers stacked volume into an extreme — before it becomes obvious on a standard chart.
Learn more →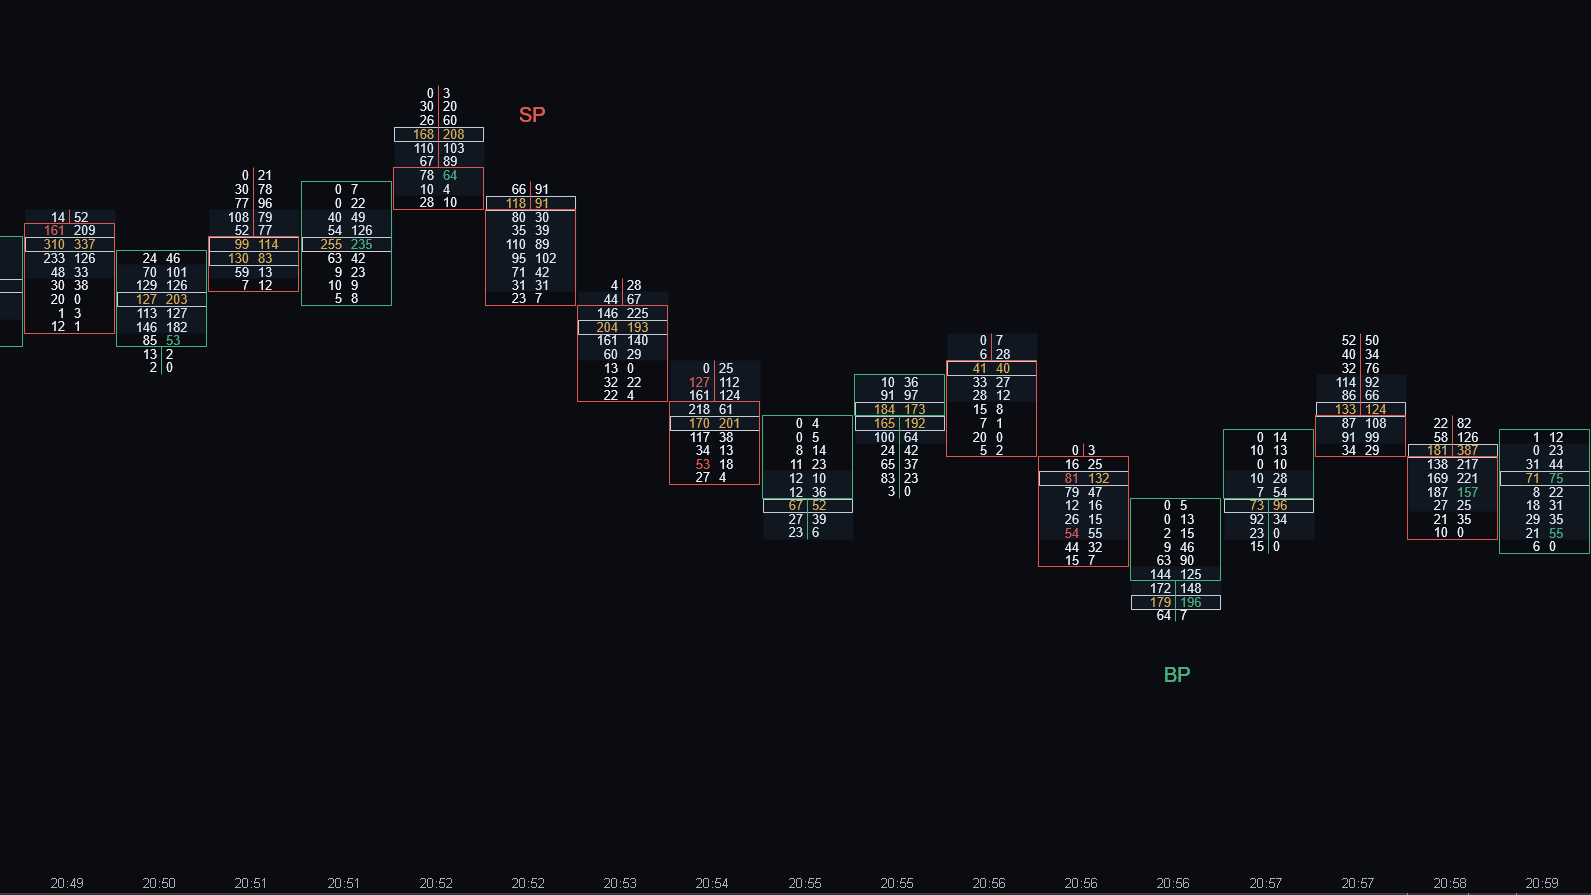
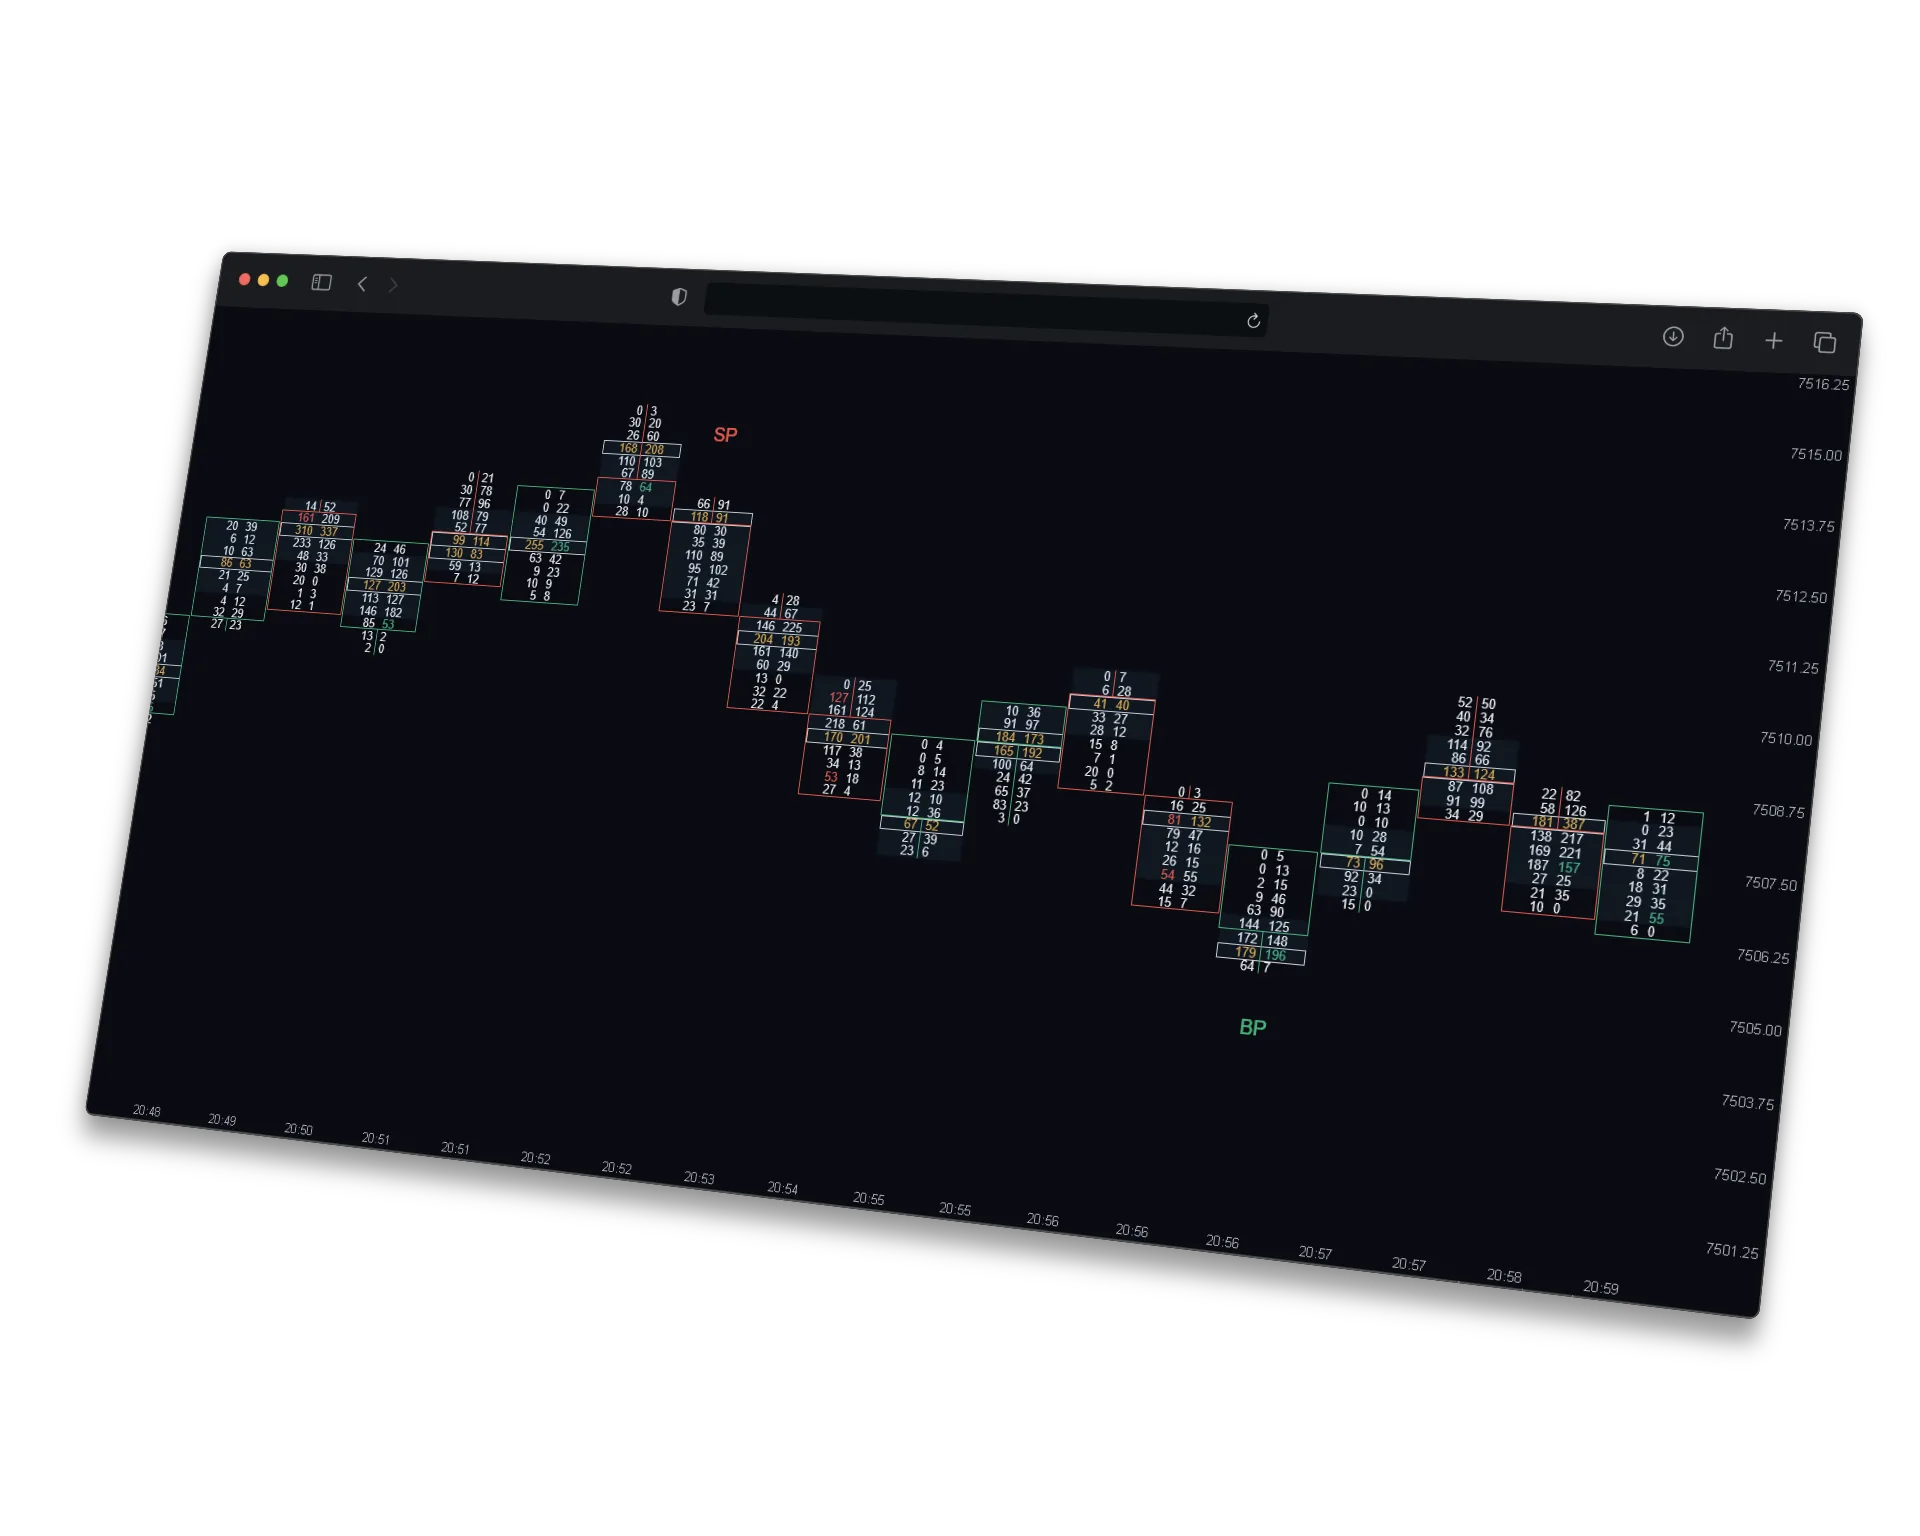
See who really took control at the extremes
Instantly flags bars where the heaviest volume printed in the wick — the absorption and rejection reads most traders miss.
Learn more →More from the toolkit
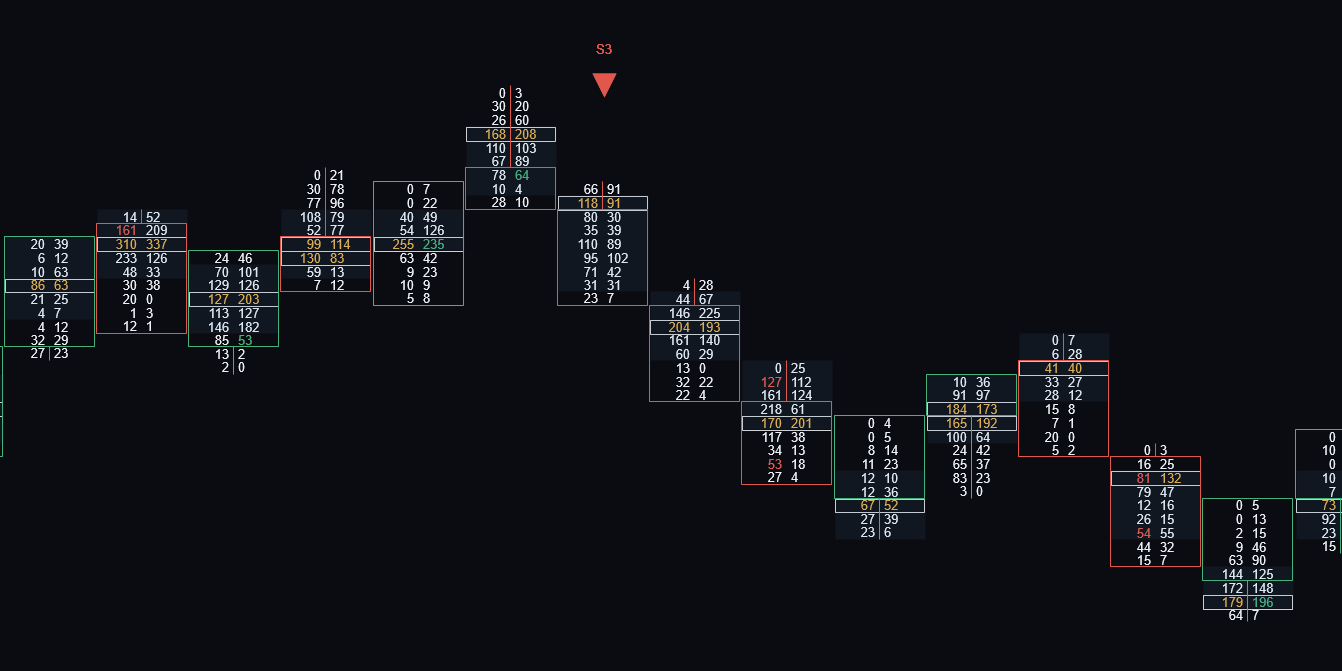
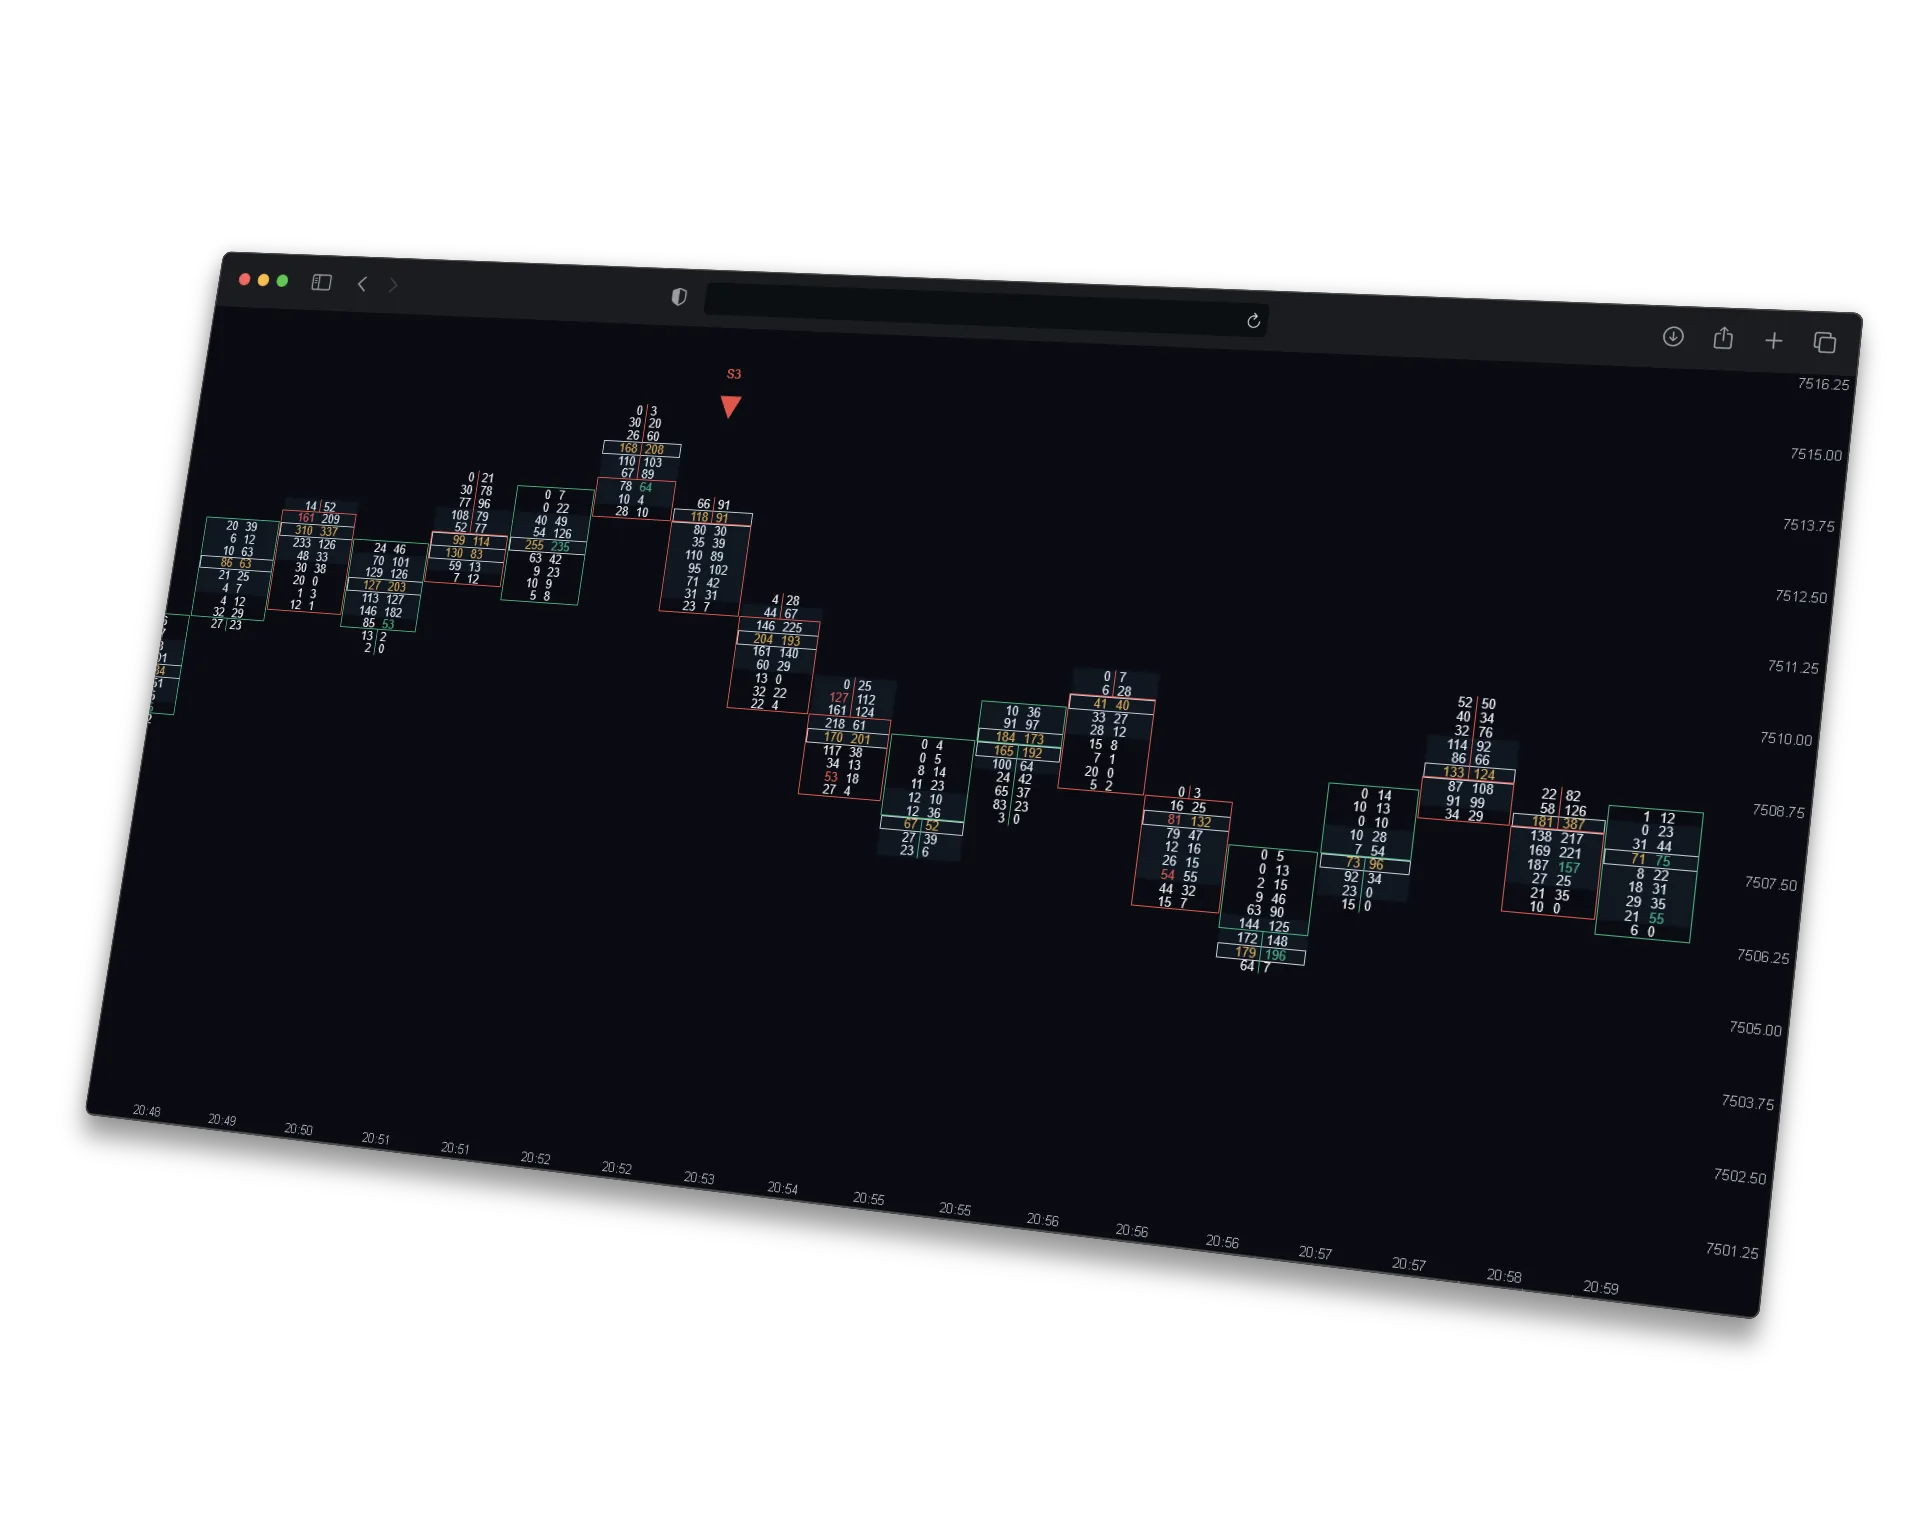
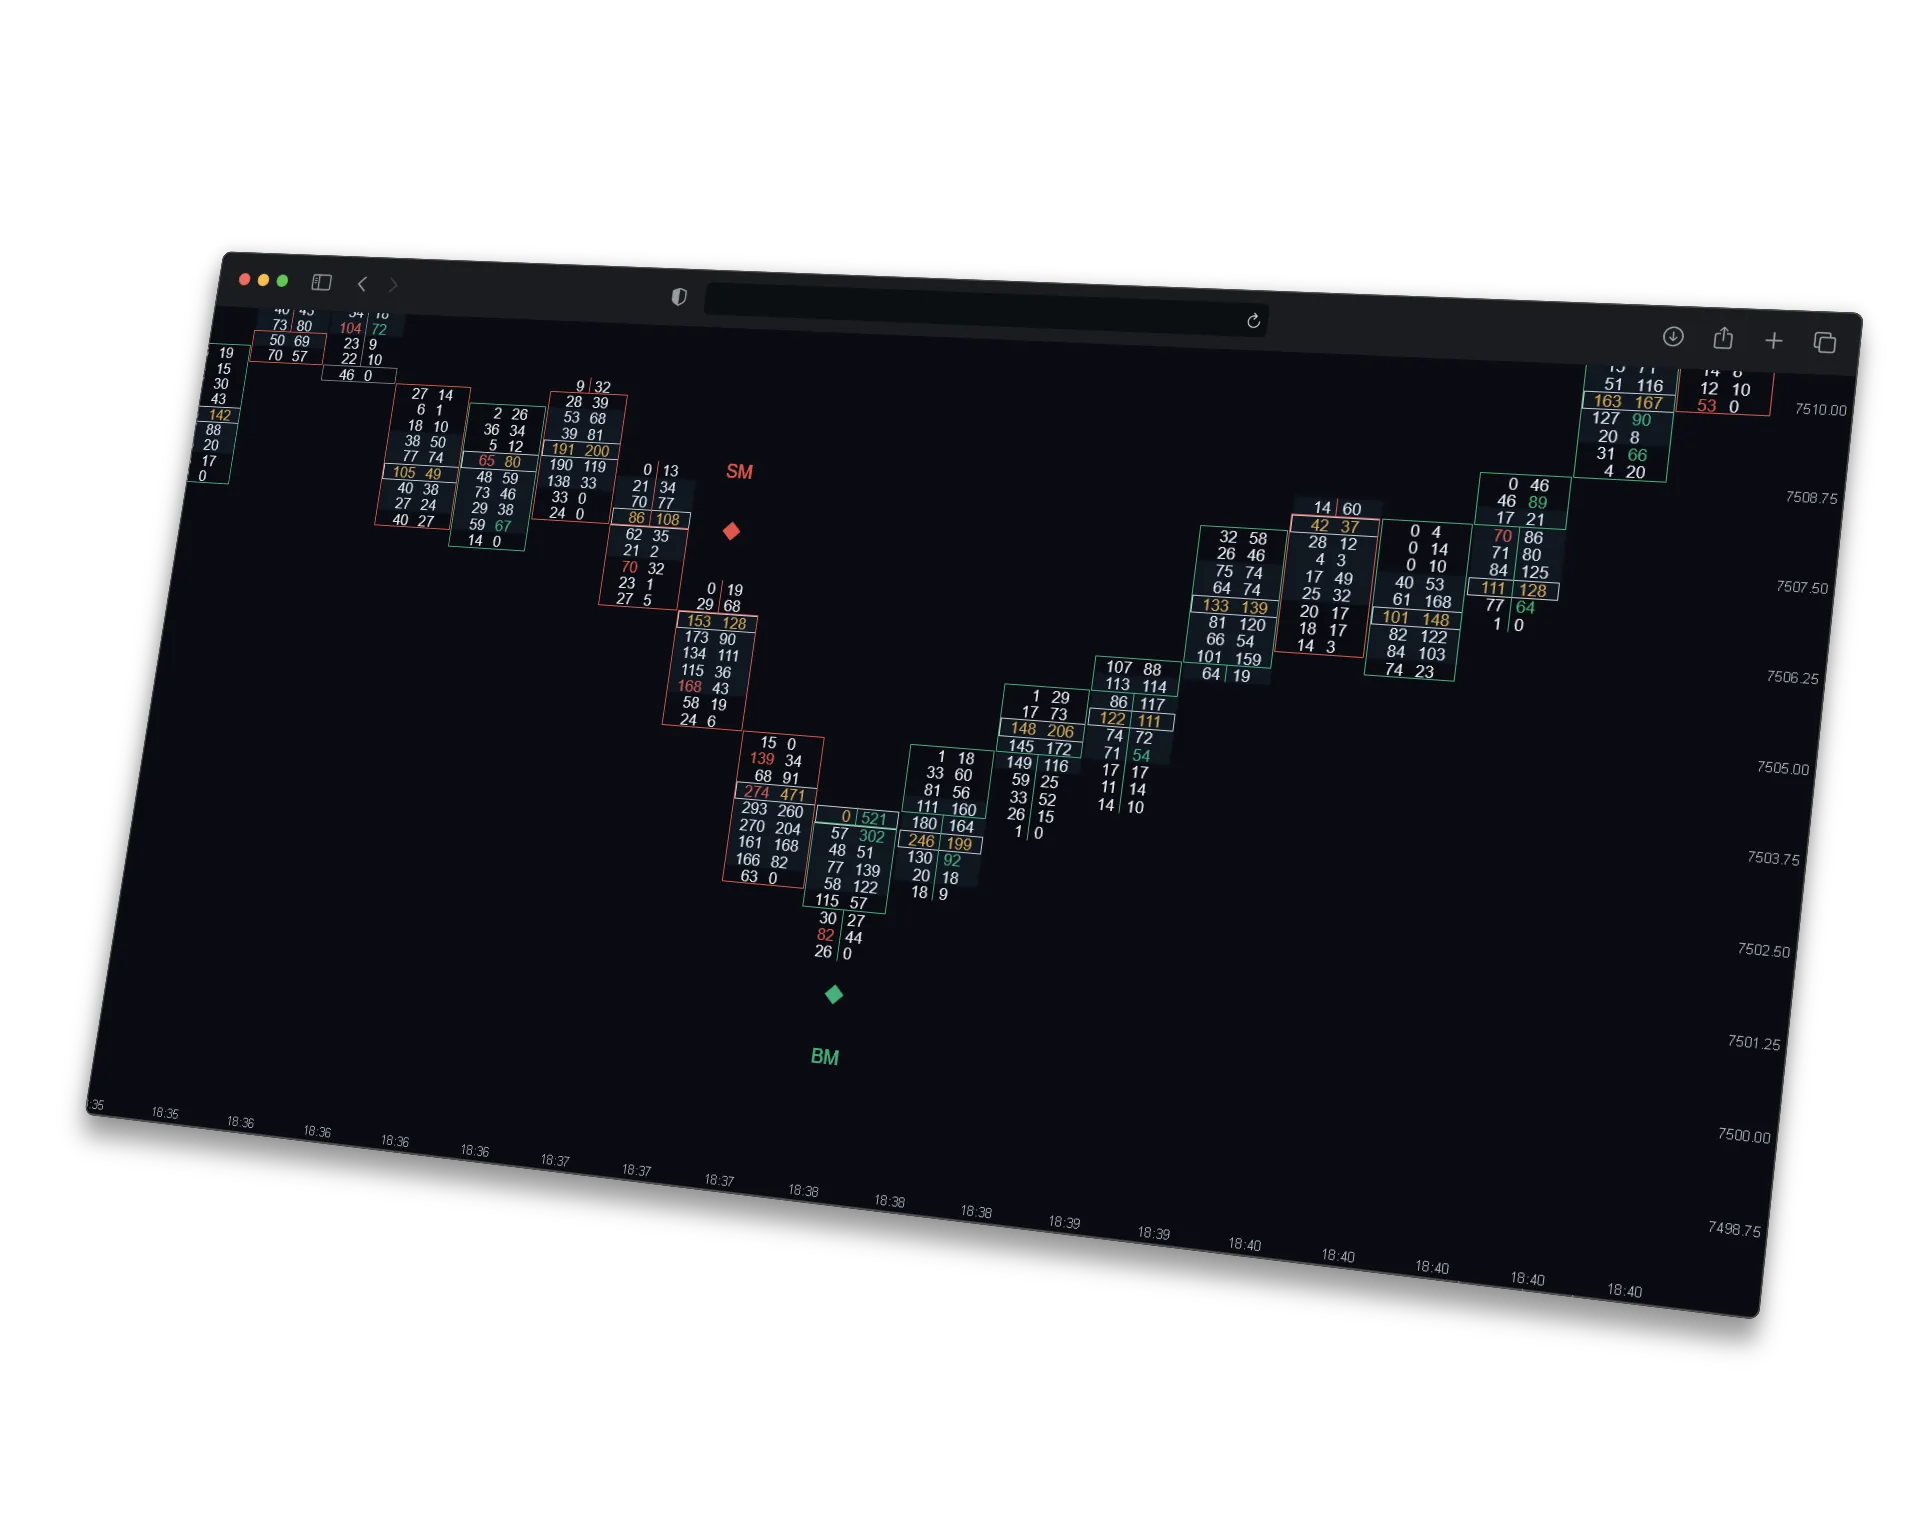
Adaptive delta-reversal signal — fires when aggression snaps back through a self-calibrating band.
Learn more →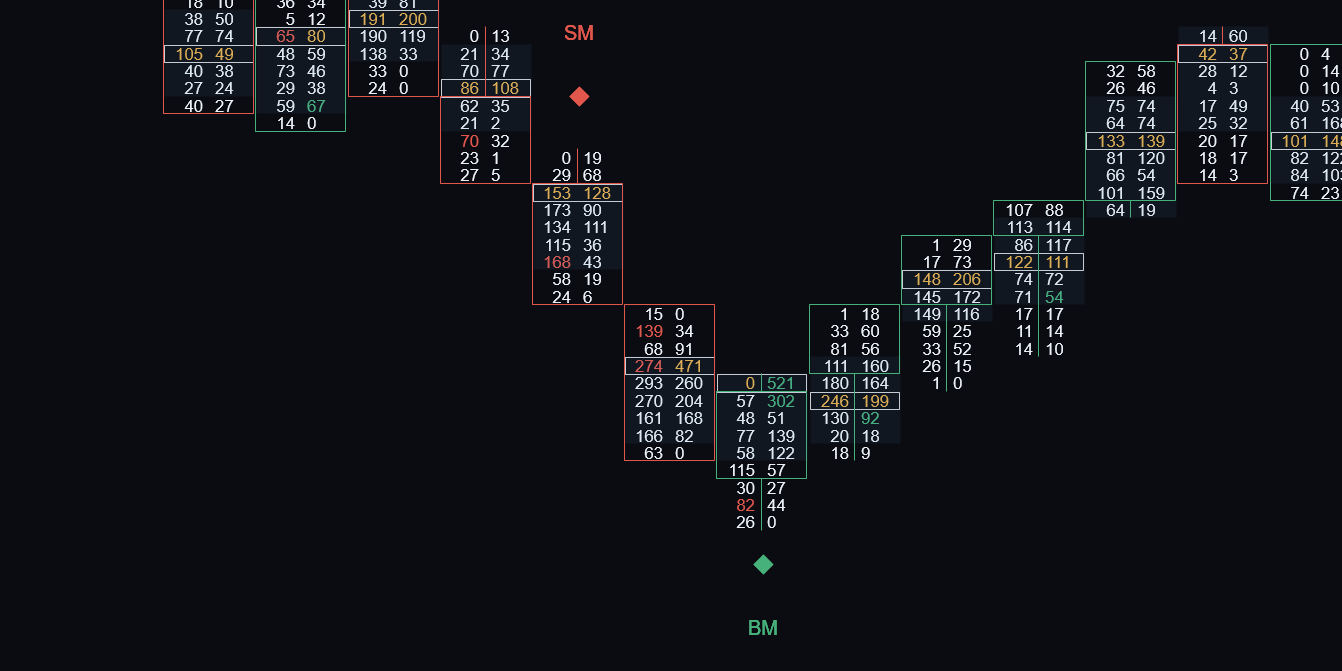
Flags statistically extreme delta bars and shows whether the aggression held into the close — or faded.
Learn more →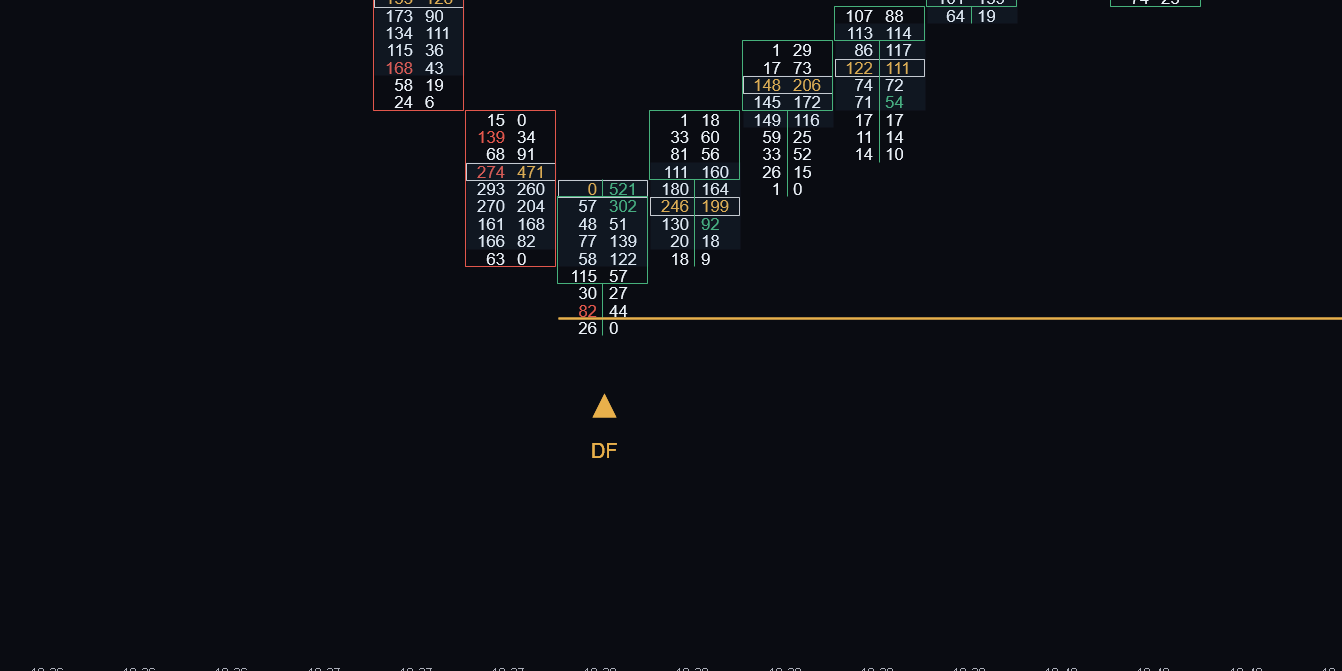
Catches the moment aggressive flow refuses to follow price to a new extreme.
Learn more →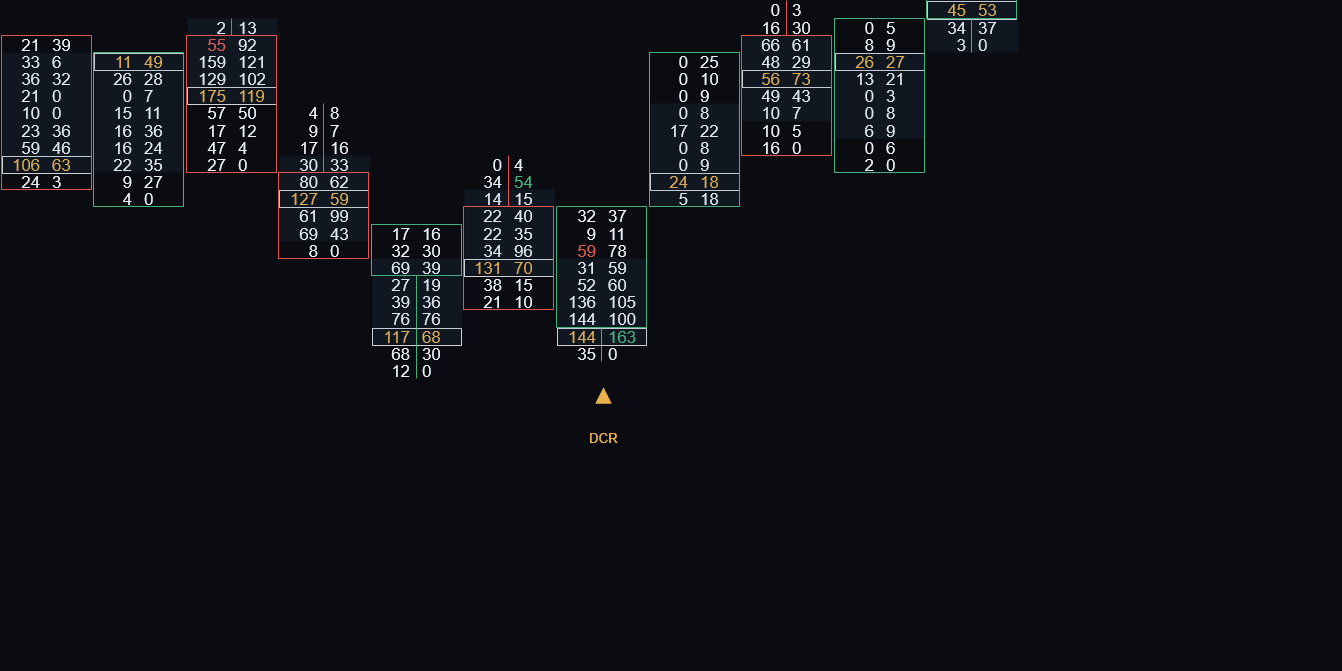
Flags failed delta-climax bars — huge one-sided delta that fails to follow through.
Learn more →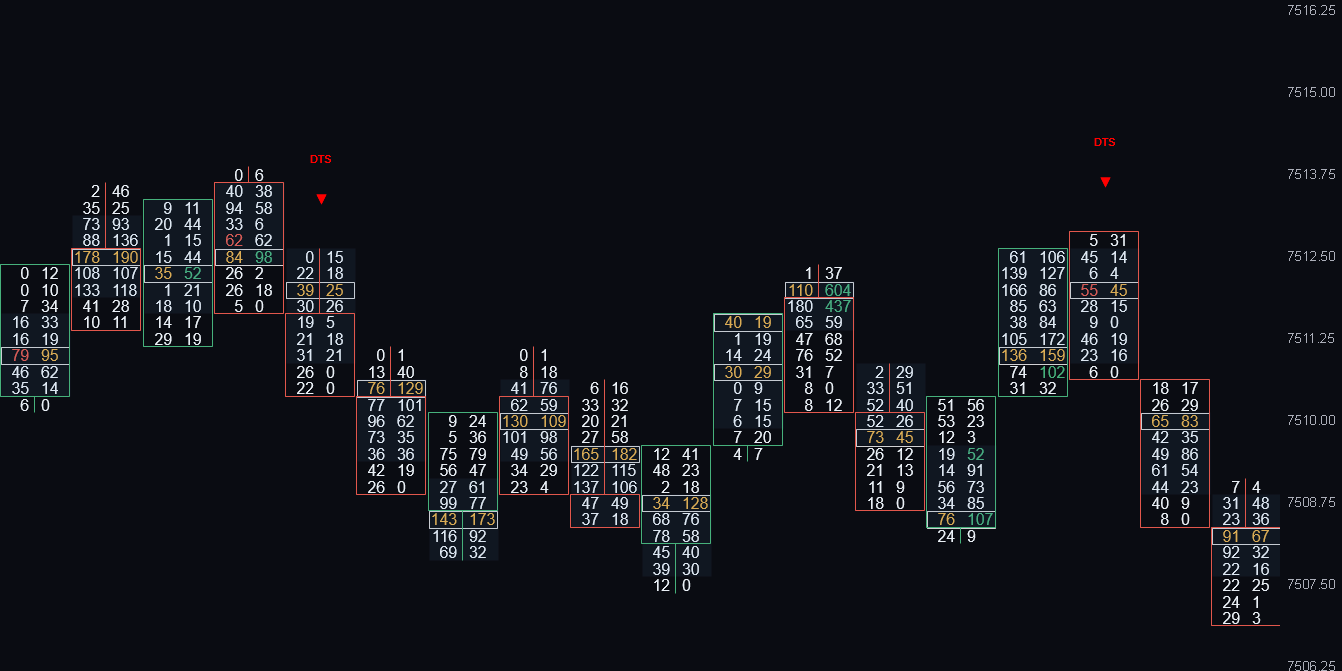
Micro-absorption reversals: a tiny opposite-delta tail at the extreme, a clean one-sided body behind it.
Learn more →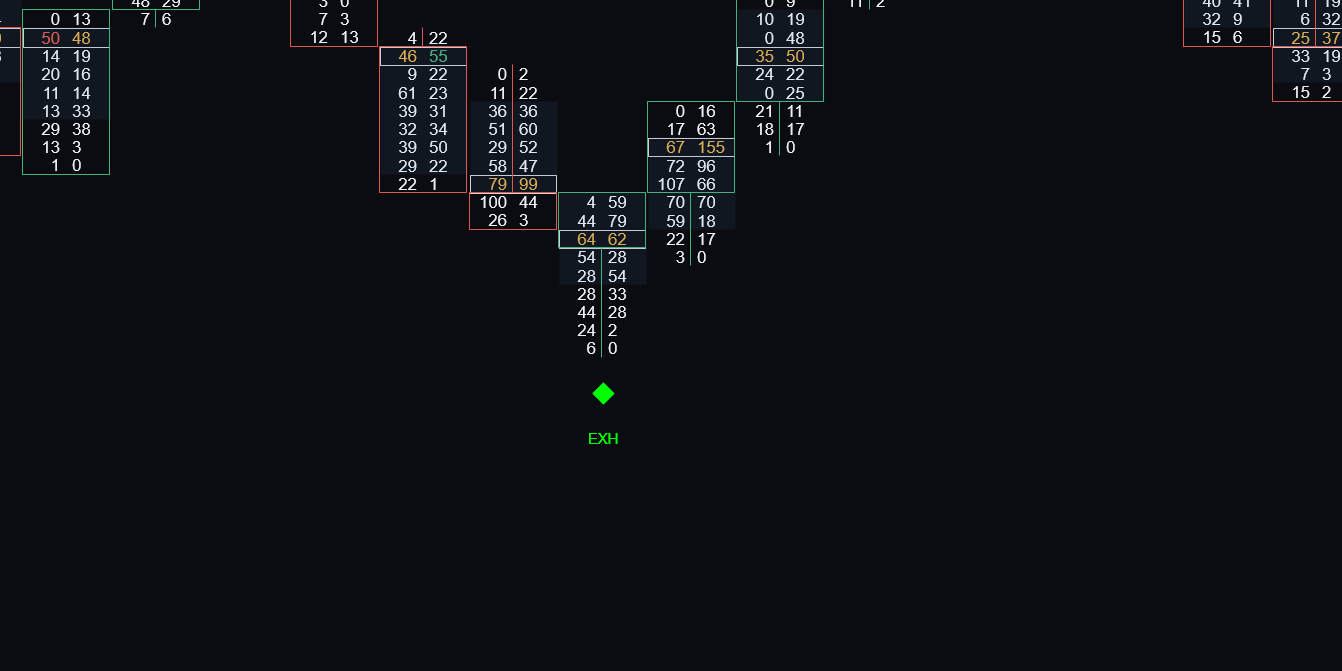
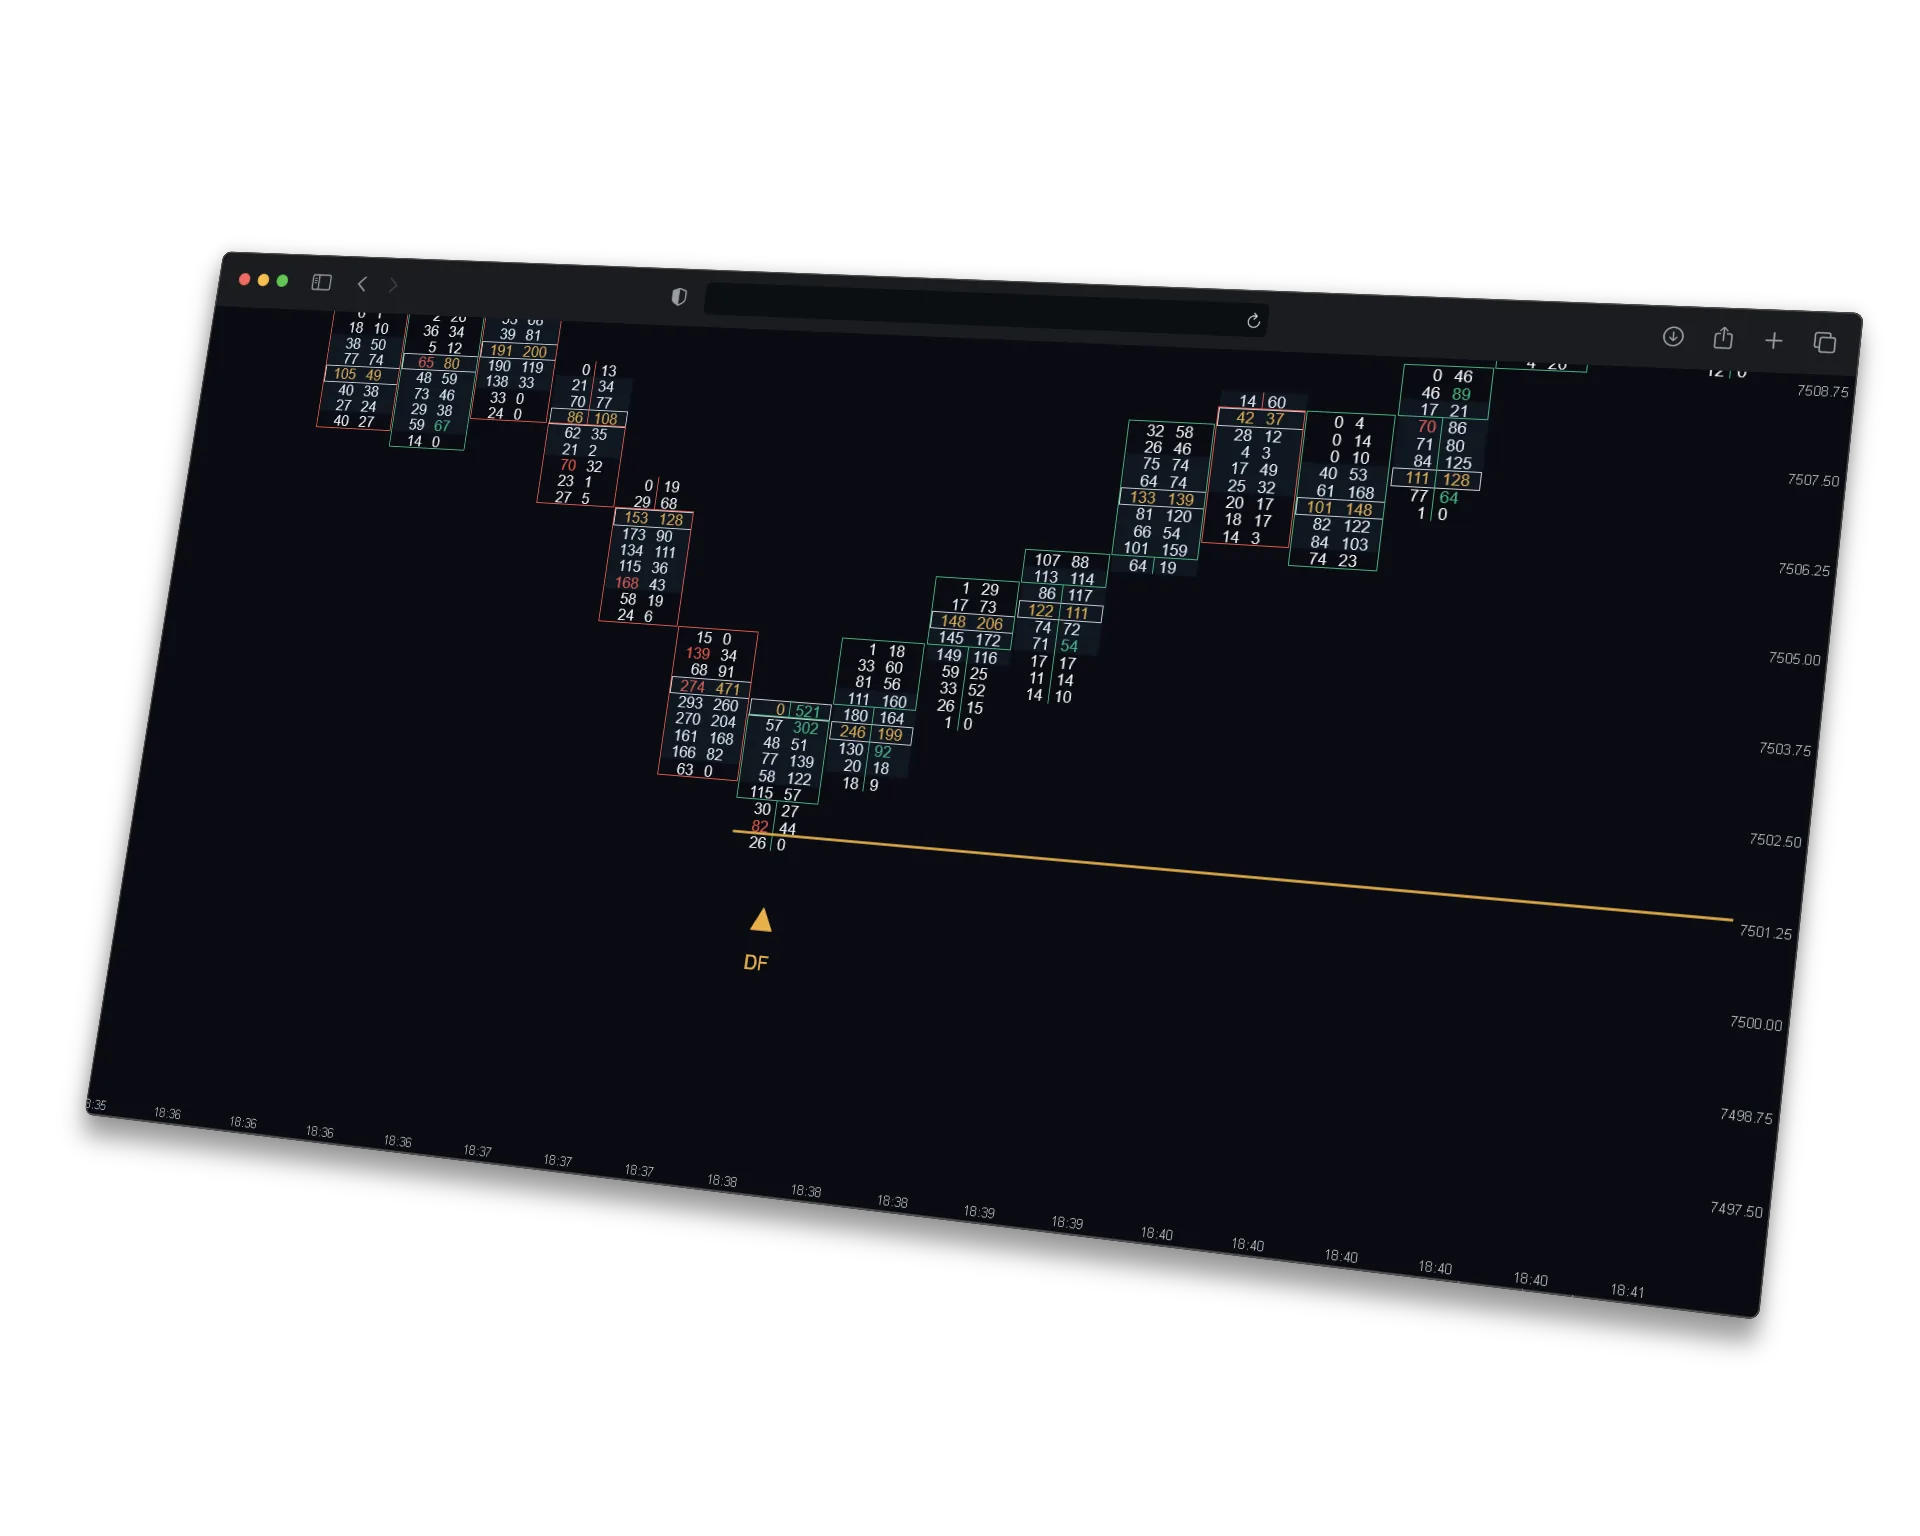
Spots the bar where a trend runs out of aggressors — a zero print at the extreme plus a reversal candle.
Learn more →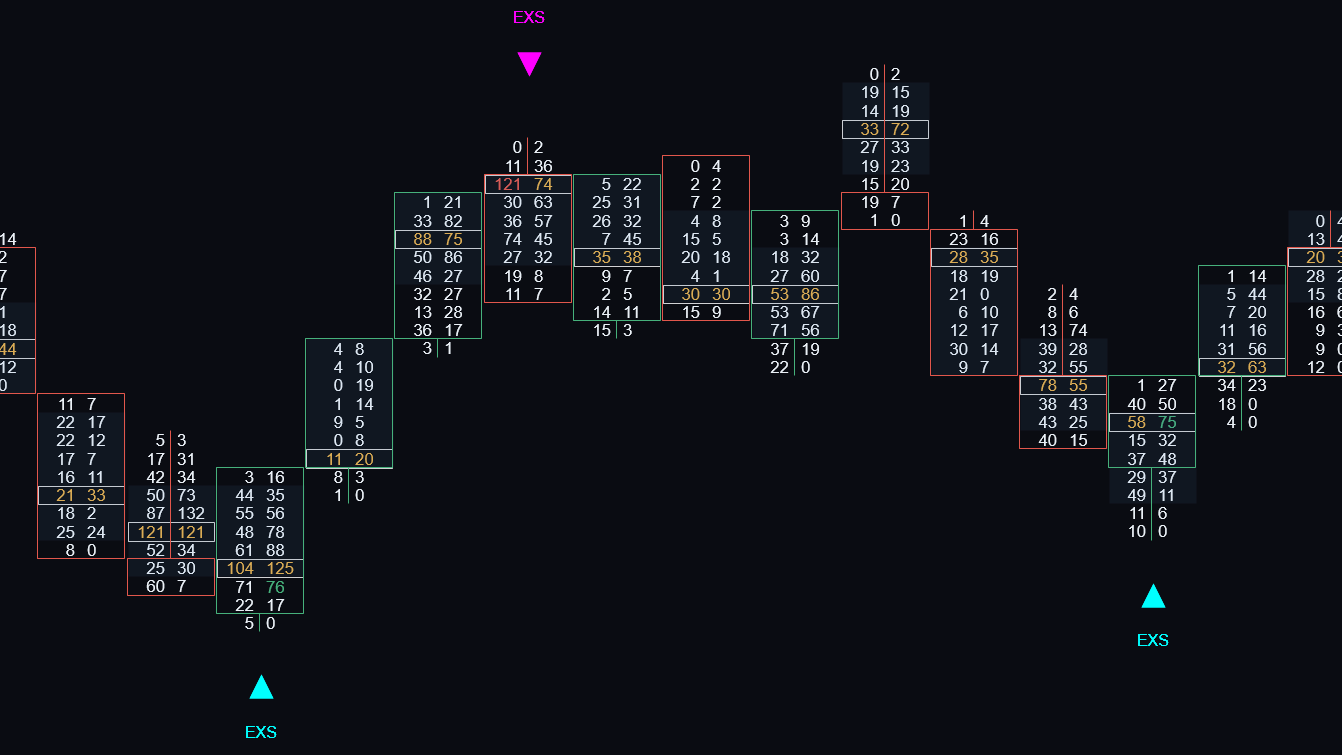
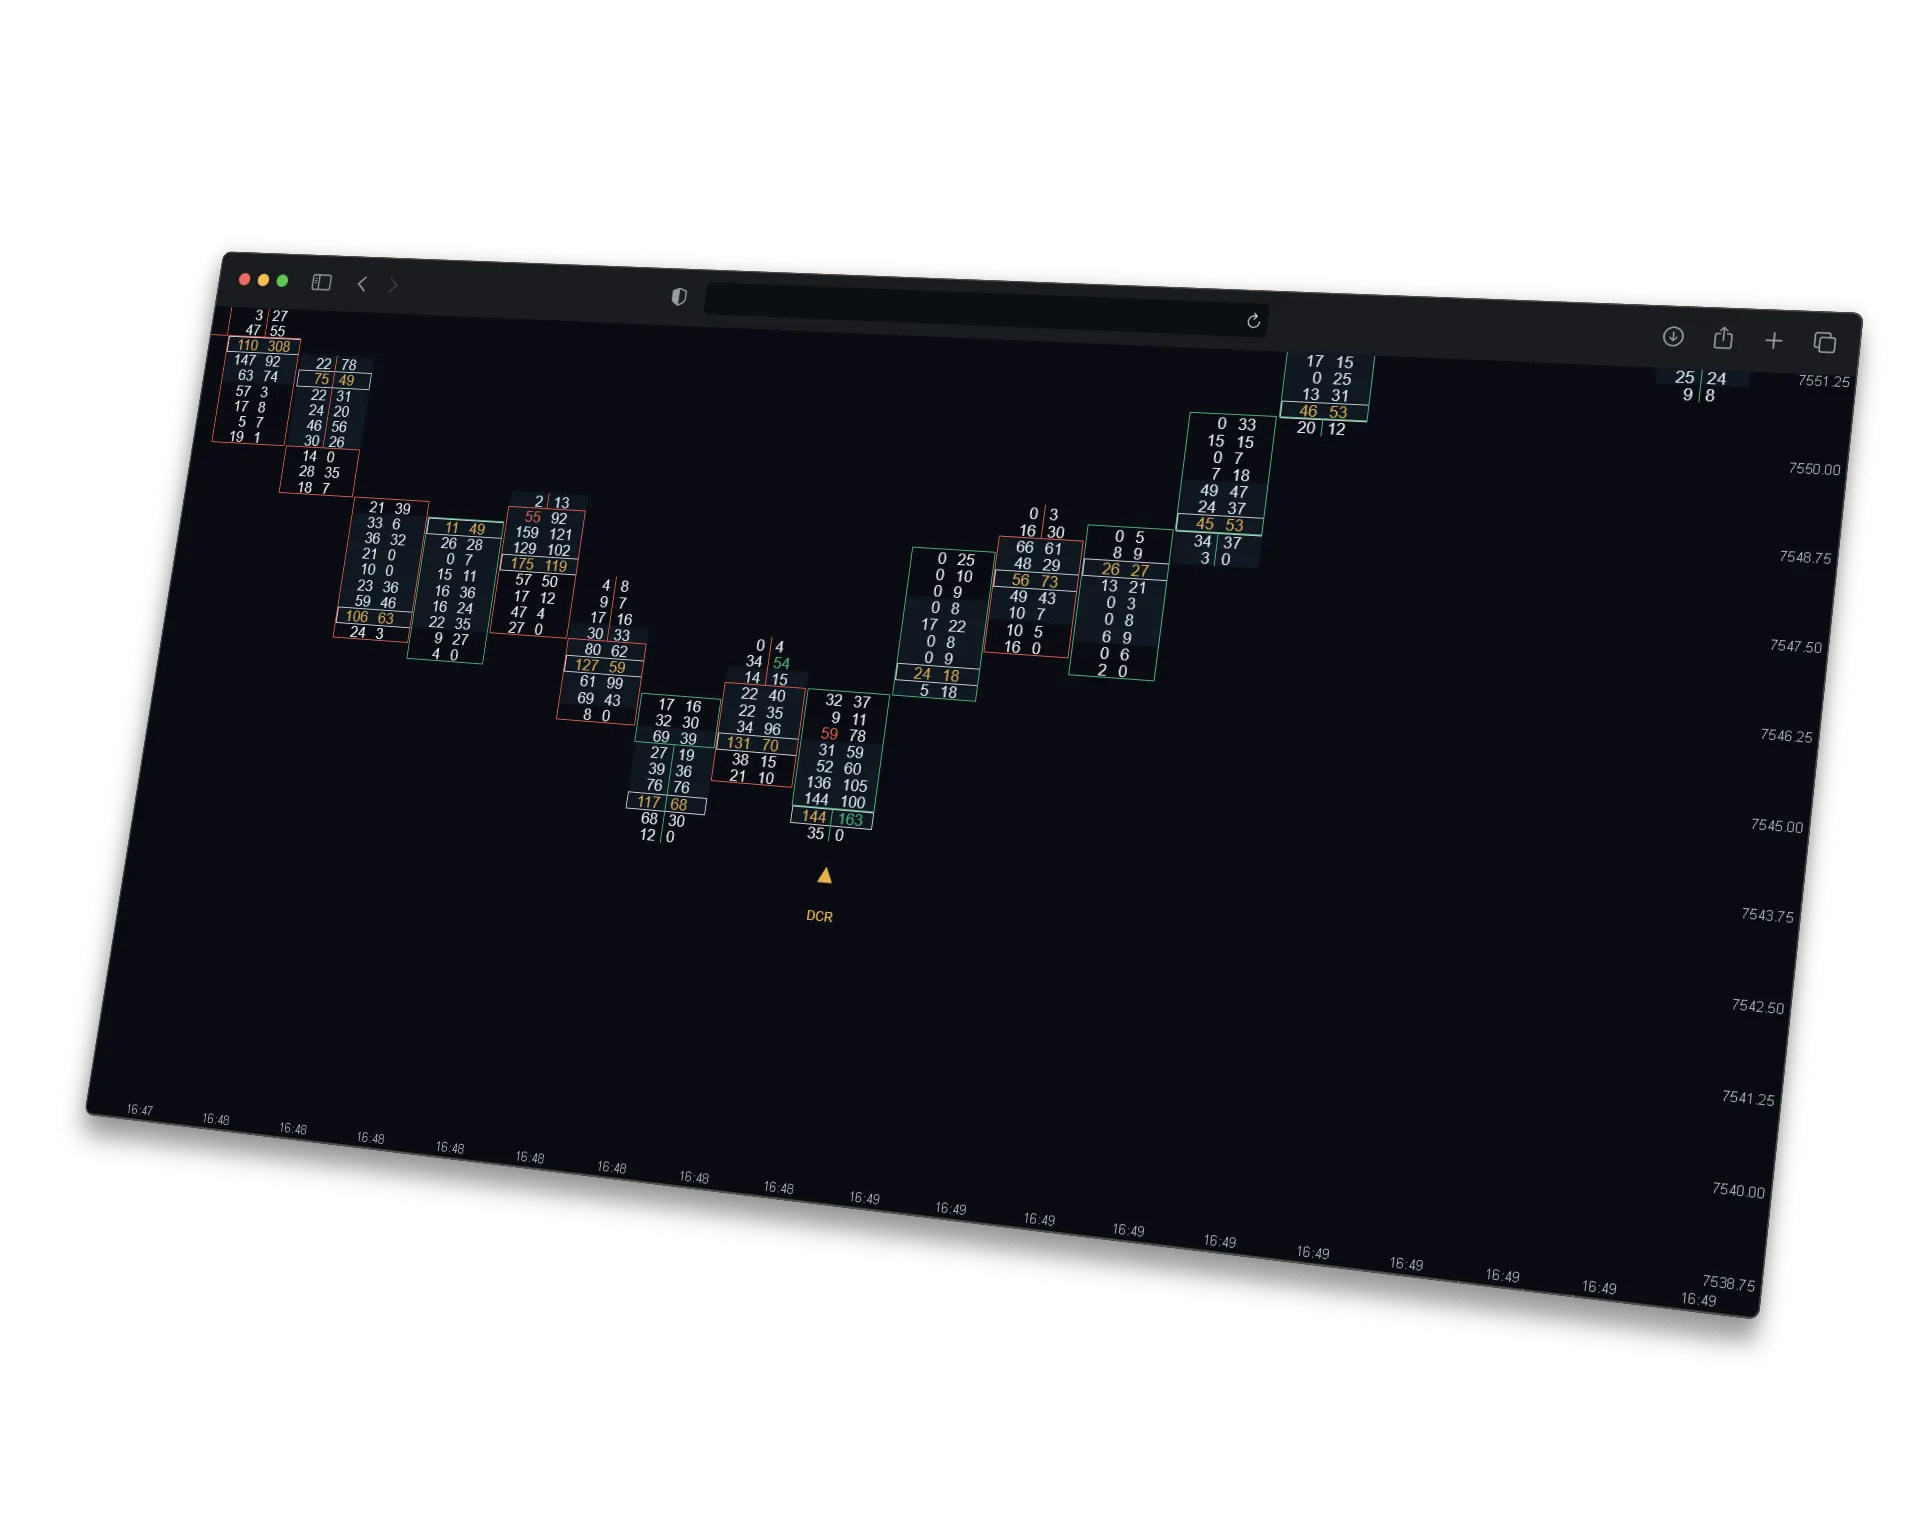
Flags fresh highs or lows printed on thinning volume and fading delta — a move running out of fuel.
Learn more →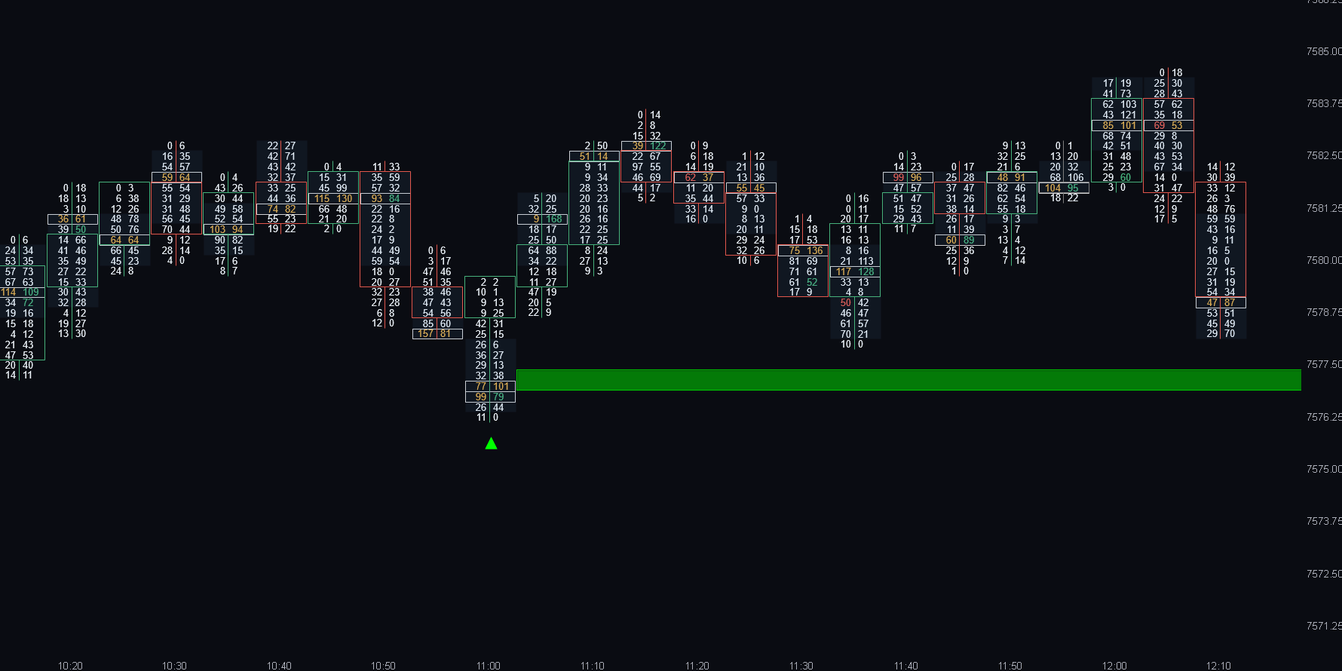
Hammer rejections that only count when the wick is backed by stacked bid/ask absorption.
Learn more →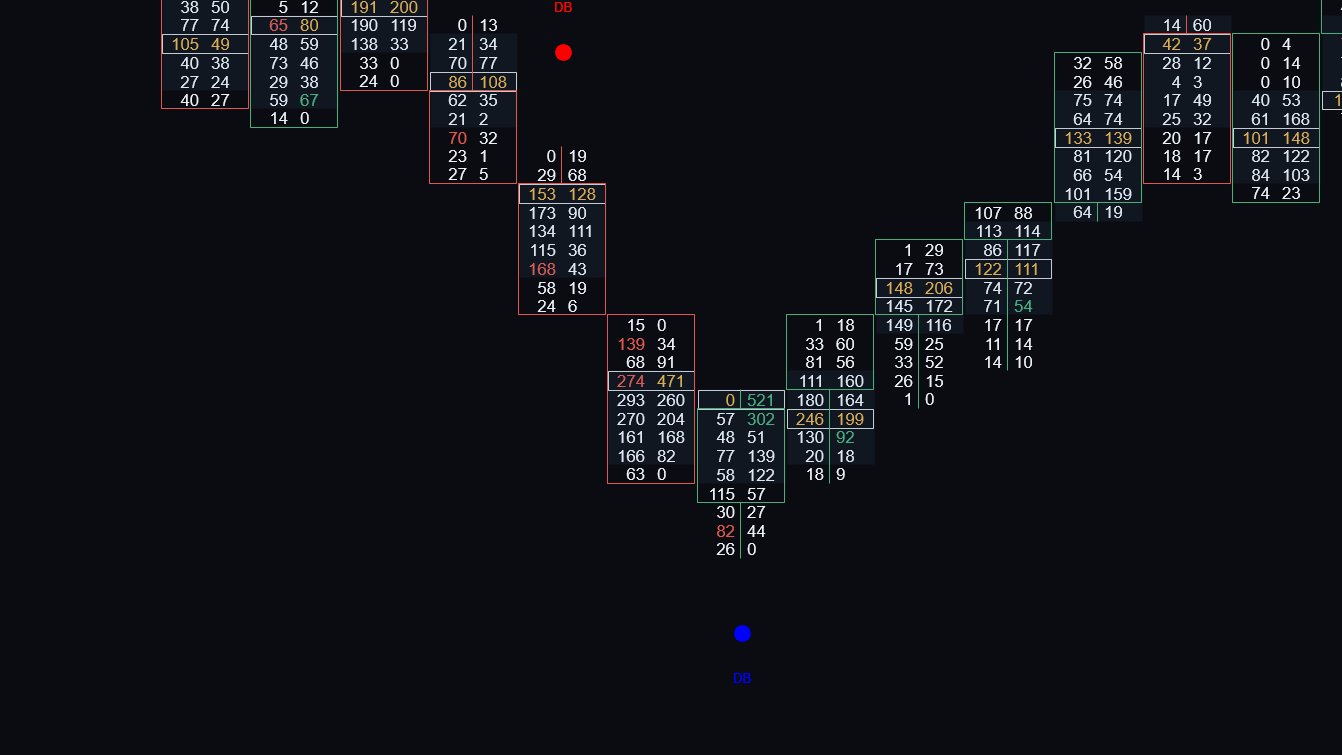
Flags the exact bars where aggressive order flow surges far above its recent norm.
Learn more →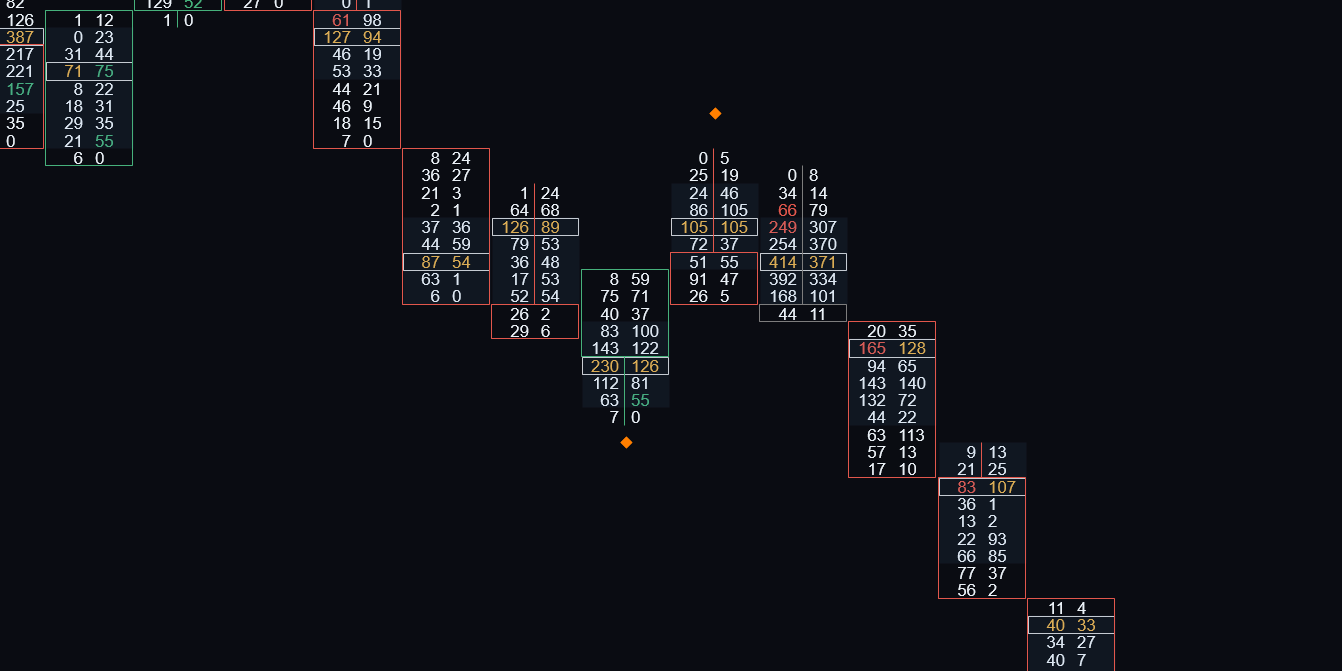
Marks clean highs and lows where the outer footprint rows taper into a delta slide with an imbalance.
Learn more →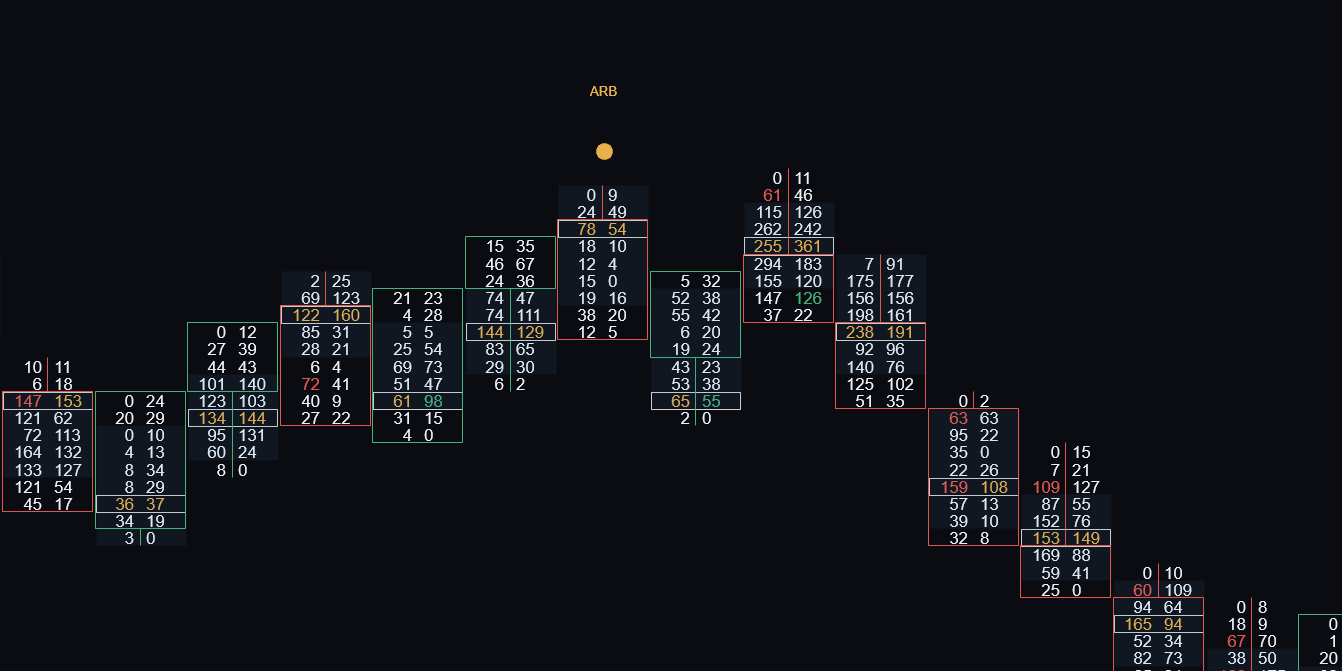
Flags bars where both sides went aggressive at the extremes — then reads the close to call the turn.
Learn more →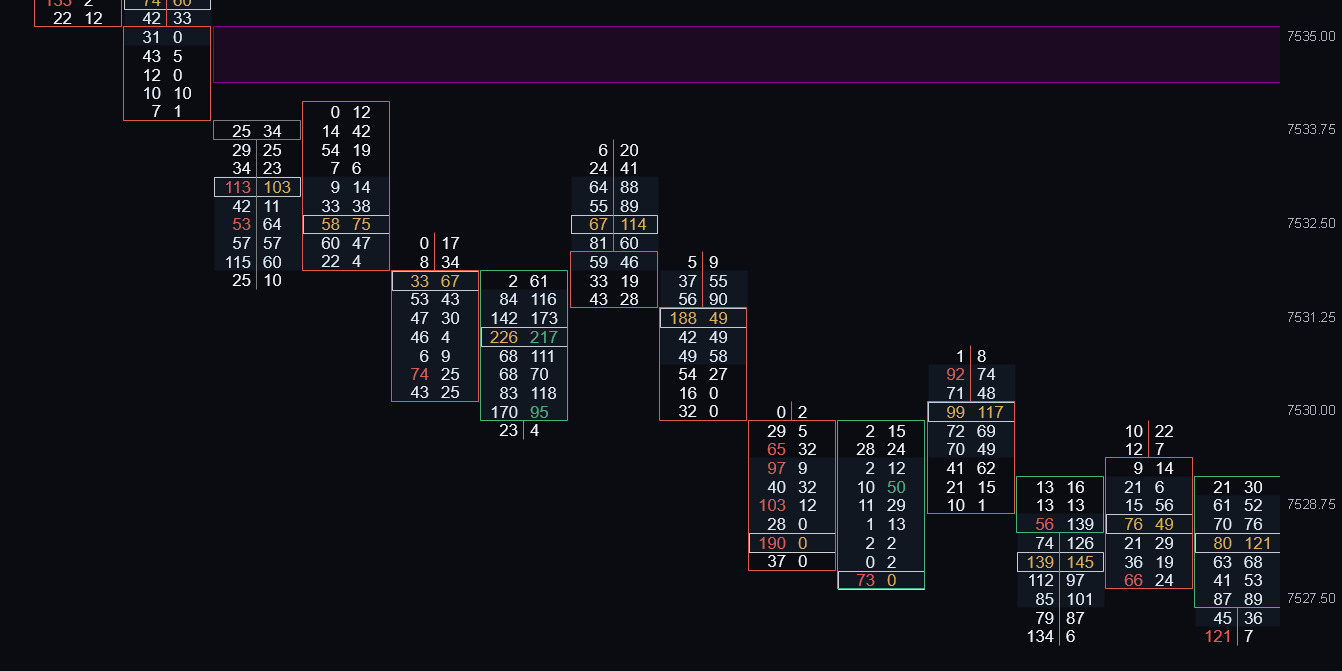
Turns stacked strong-delta levels inside a bar into S/R zones that project forward until tested.
Learn more →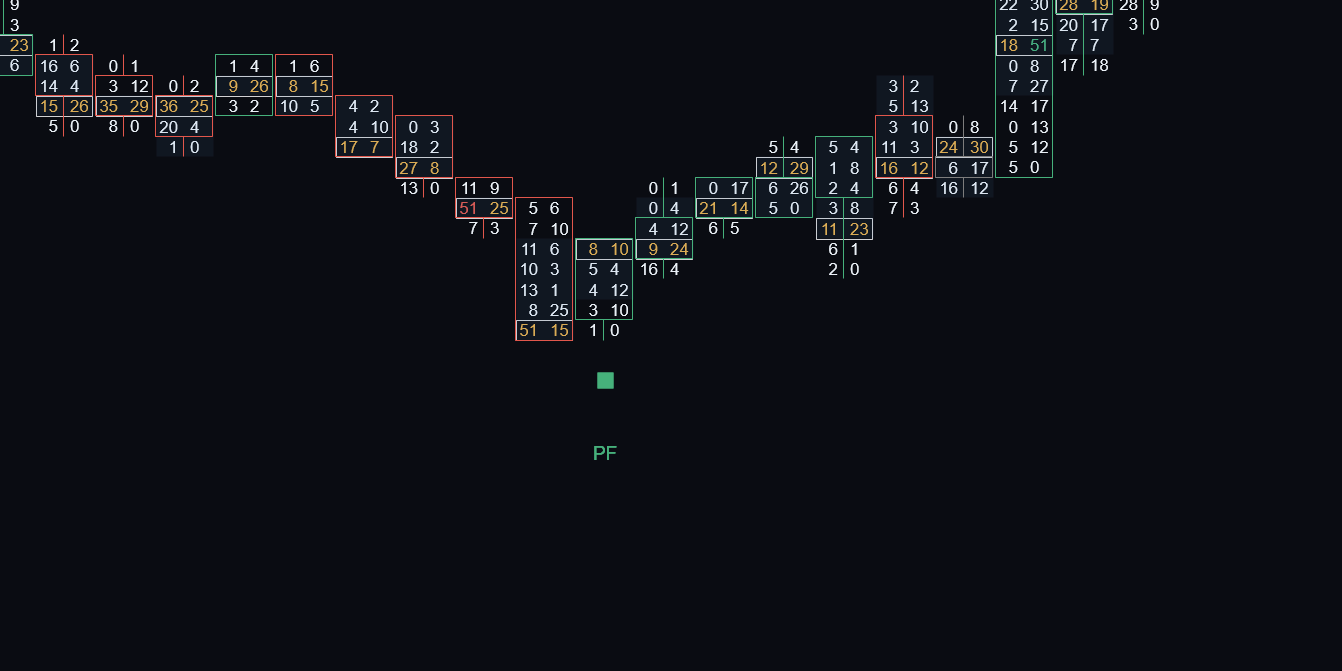
Flags the 2-bar moment control changes hands — the POC jumps from one extreme to the opposite.
Learn more →The Order Flow Suite for ATAS: every indicator you just explored, and every one we release next, in a single one-time purchase.
Purchase once and your indicators are linked to your ATAS account. No license keys, no manual installation, no activation codes — open ATAS and they’re there.
Pay securely by card in under a minute — and tell us the email your ATAS platform logs in with.
Your indicators are granted to that ATAS account. No license keys, no files, no manual setup.
Your tools are waiting in your indicators list. Add one to any footprint or cluster chart.
Read the order flow with professional tools built natively for ATAS — nothing else to configure.
Footprint Lab exists because the studies we wanted on our own charts didn’t exist. Here’s what that means for you.
Every indicator started as an internal tool for our own futures trading. If it doesn’t survive live tape on our charts, it doesn’t get shipped.
The same logic has been running with traders using our Sierra Chart tools. The ATAS editions are native rebuilds — not quick ports.
ATAS ships excellent built-ins — we don’t resell what you already have. Every tool adds a read the platform doesn’t: sequences, micro-absorption, statistical delta extremes.
No win rates, no “institutional secrets”, no signal service. Rule-based studies that show their work on the chart — you stay the trader.
Try any indicator free for 7 days, on your own ATAS data. One-time price, no subscription, nothing to cancel.